
This section describes the Reporting function which is used to generate reports that help overview your network environment to define objects, monitor the system and plan workloads.
This section covers the following topics:
See also the cross-reference reports described in the section Cross-References.
The report types available you can select from the Reporting dialog are described in the following table. Reports that require special user privileges are indicated in the table.
| Report Type | Description | |
|---|---|---|
| Log -
reports
(see below) |
The LOG - reports
provide job or network processing information
for a given date/time range, extracted from the Entire Operations log. The
following applies to all job logs:
Only those networks are displayed for which the user has read access. The user has read access if:
|
|
| Log - Terminated Jobs | Lists all jobs that ended normally (OK).
See also Example of Log - Terminated Jobs. |
|
| Log - Abended Jobs | Lists all jobs that ended abnormally (not
OK).
See also Example of Log - Abended Jobs. |
|
| Log - Jobs not started | Lists all jobs that were not started.
A job cannot start, for example, if its latest start time exceeded, or if it is waiting for an input condition or a resource. See also Example of Log - Jobs not started. |
|
| Log - Jobs with permanent errors | Lists all jobs that fail to run because of permanent errors. | |
| Log - Networks not activated | Lists all networks that could not be
activated, because an extraction or activation error occurred.
See also Example of Log - Networks not activated. |
|
| Accounting Information | Information on job accounting data (for
example, job elapsed times and CPU times) of previous network and job
executions.
See also Example of Accounting Information. |
|
| Network Description (short) | Displays information on networks and jobs
as defined on the master database, including scheduling information,
prerequisites and End-of-Job checking and actions.
See also Example of Network Description (short). |
|
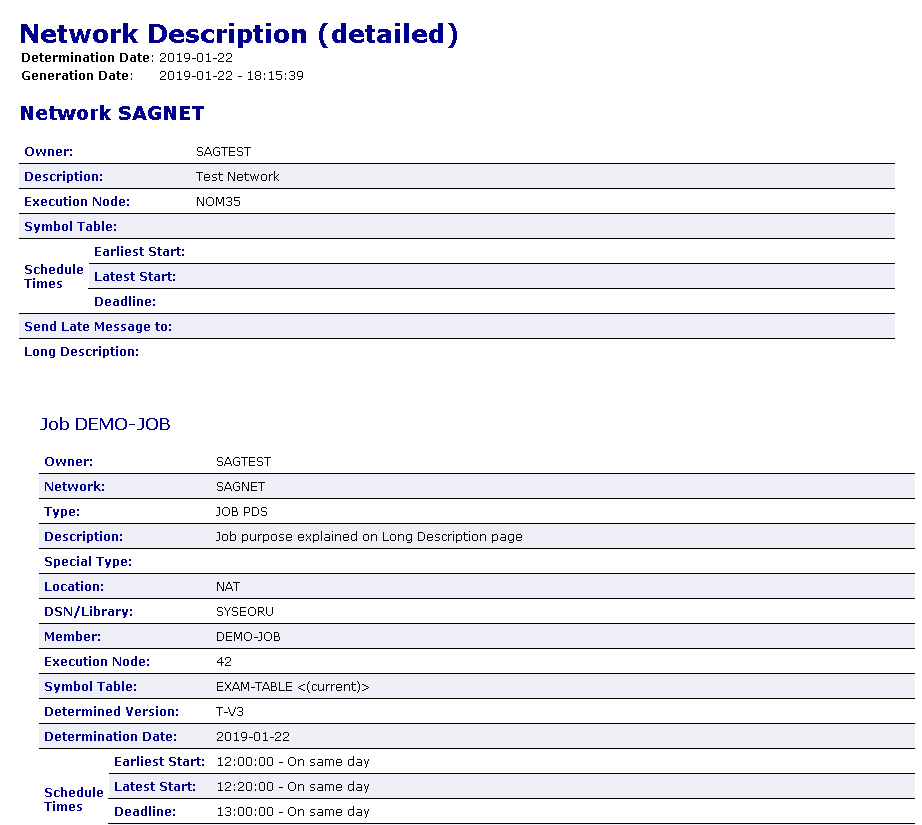
| Network Description (detailed) | Displays the same information as the Network Description (short), but includes all prose descriptions defined at the network, job or event level using the Editor facility. | |
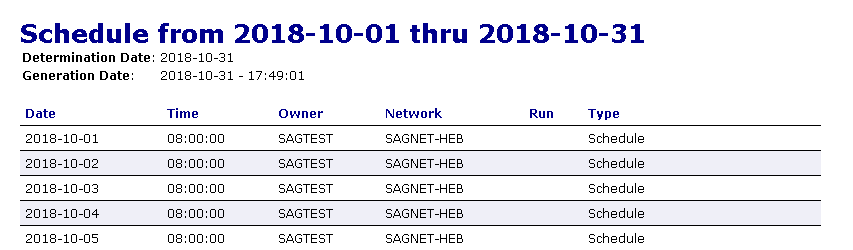
| Schedule of Jobs | Displays a jobs schedule for a specific
date range.
See also Example of Schedule of Jobs. |
|
| Network Start Summary | Status report of all network starts for a
given day, regardless of whether they:
See also Example of Network Start Summary. |
|
| Network Schedule Overview | Overview of scheduled and/or not yet
executed, system-wide network activations.
See also Example of Network Start Summary. |
|
| Activation Overview | Overview of network activations.
See also Example of Activation Overview. |
|
| Compare Symbol Tables | (Special user authorization required.)
Displays the results of the comparison of one or more symbol tables. See also Example of Compare Symbol Tables. |
|
| Compare Networks | (Special user authorization required.)
Displays the results of the comparison of one or more networks. The report shows whether jobs defined in one network exist also in another network. Additionally the attributes of the networks and of all jobs having the same name are compared. See also Example of Compare Networks. |
|
| Node Overview | (Special user authorization required.)
Overview of available nodes. See also Example of Node Overview. |
|
| Network/Job Usage | (Special user authorization required.)
Lists networks and related subnetworks (jobs of the type NET) as well as jobs activated by an End-of-Job action or a recovery job. See also Example of Network/Job Usage. |
|
| Network Start Overview (Bar Chart) | Displays the network start time and the
end time of a previous network execution as a
bar chart.
See also Network Start Overview (Bar Chart). |
|
| Network and Job Start Overview (Bar Chart) | Displays the network and job start as a
bar chart.
See also Example of Network and Job Start Overview (Bar Chart). |
|
| Network Schedule Overview (Bar Chart) | Displays the schedule selection of a network as a bar chart. | |
| Monitor Tasks and Functions Overview | Displays data collected from performed
Monitor tasks and called Monitor functions in a task time table.
See also Example of Monitor Tasks and Functions Overview. Note: |
|
| Monitor Tasks and Exits Overview | Displays data collected from performed
Monitor tasks and called Monitor exits in a task time table.
See also Example of Monitor Tasks and Exits Overview. Note: |
|
 To view all reports submitted for processing
In the object workspace, select the General node and choose from the context menu.
Or:
In the Command box, type
REPORTS
(see Direct Commands) and press ENTER.
A Reporting window similar to the example below opens:
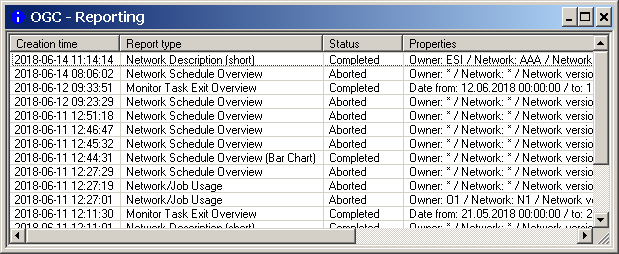
A list of scheduled and ready reports appears.
(If no reports exist, the table in the Reporting window is empty.)
The reports listed in the table are used to manage and view all reports requested by the current user. Report generation is invoked within Entire Operations GUI Client whereas the reports themselves are generated asynchronously in the background via the Entire Operations Monitor.
The report list contains the following columns:
| Creation time | Date and time when a report generation was initiated arranged in descending order (latest date first). | ||||||||||||||||||
| Report type | Report type requested. | ||||||||||||||||||
| Status |
|
||||||||||||||||||
| Properties | Properties settings used to generate the report. | ||||||||||||||||||
Press F5 or choose or (specifies an automatic refresh interval) from the context menu to refresh the processing status in the Status column.
From the table in the Reporting window, you can select the report you want to generate by choosing from the context menu to determine the file to be created from the report: see Report Output Options.
This section provides instructions for generating or regenerating a report in online mode with the Reporting function.
Report data is evaluated for the current day by default. If you want to change the evaluation date, use the Determination Date function.
Note:
The selection options provided to generate a report allow
extremely flexible reporting. On the other hand, it allows you to formulate
requests that will cause very many Adabas calls. For this reason, it is
possible to disallow asterisk/wildcard report selection for non-administrator
users: see Range
Specification and Usage Restrictions.
To generate a report
From the table in the Reporting window, select from the context menu.
A Reporting dialog similar to the following opens:
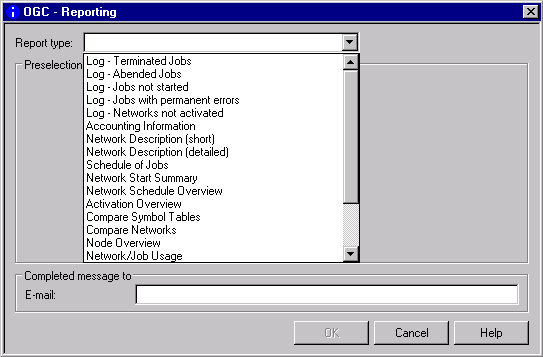
From the drop-down list box next to Report type, select the required report type.
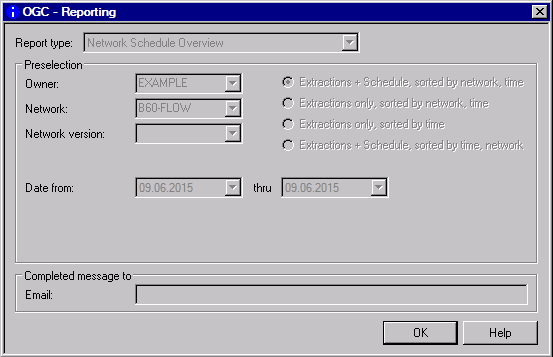
Depending on the report type selected, additional input fields appear in the Preselection section of the Reporting dialog. They are explained in Fields and Columns: Reports.
In the Preselection section, enter the required selection criteria and output options.
In the Completed message to E-mail field, enter an e-mail address if you want to send a notification when the report generation has finished.
Choose OK when you are finished.
The report is added to the table in the Reporting window and queued for processing.
If you choose Cancel, the selected report type and selection criteria are retained in the Reporting dialog until you open it again and choose OK.
When the report has been processed successfully, the Status in the Reporting window changes to Completed.
You can then save the report as described in Report Output Options.
To regenerate a report
From the table in the Reporting window, select a generated report and choose Regenerate from the context menu.
A Reporting dialog opens with the properties settings of the previous report generation.
If required, change the current settings by replacing the values in the Preselection section and the Completed message to Email field of the dialog. The fields are explained in Fields and Columns: Reports.
Choose OK.
The report is added to the table and queued for processing.
The same applies as stated for generating a report.
To display the properties of a report
Select the required report from the table in the Reporting window and choose from the context menu.
A Reporting dialog similar to the example below appears where the properties (report type, owner, network and e-mail) are displayed:
To delete single or multiple reports
From the table in the Reporting window, select one or more generated reports and choose from the context menu or press DELETE.
The selected reports are removed from the table.
The input fields for specifying selection criteria and output options for the report to be produced are explained in the following table. The input fields correspond to the columns contained in the report output file.
Depending on the report type (to be) produced, the following fields and columns are available:
| Field/Column | Description | ||||||||||||||||||||||||
|---|---|---|---|---|---|---|---|---|---|---|---|---|---|---|---|---|---|---|---|---|---|---|---|---|---|
| Owner | Name of an owner or a range of names. | ||||||||||||||||||||||||
| Network | Name of a network or a range of names. | ||||||||||||||||||||||||
| Network version | Name of a network version or a range of names. | ||||||||||||||||||||||||
| Job | (Applies to Log -
reports and Job Schedule only.)
Name of a job or a range of names. If no job name is defined, the corresponding output column
in the report file contains a dash ( |
||||||||||||||||||||||||
| Date/Time from/thru | Start date/time and end date/time of the
reporting period.
Valid number range: 1 to 31. Default: current date and time range 00:00 until 23:59. For Monitor Tasks and Functions Overview and Example of Monitor Tasks and Exits Overview the default time range is 00:00 until the current time. For Network Schedule Overview reports, the start and end dates can be in the past. In this case, only those network activations are logged, which have not yet been executed. These can be caused by symbol prompting, which has not been completed, or by an Entire Operations Monitor, that has not been active over an extended period of time. |
||||||||||||||||||||||||
| Run from/thru | Start and end run numbers for a range of
active job networks.
Can be used only if owner and network have been selected. Default range: 1 - 9999 (all) |
||||||||||||||||||||||||
| Completed message to Email | E-mail address of the user who receives
an e-mail notification when the report generation completed successfully
(Subject: EOR: OGC Report ended ok) or when the report
generation was aborted (Subject: EOR: OGC Report ended not
ok).
|
||||||||||||||||||||||||
| Save As File | See Report Output Options. | ||||||||||||||||||||||||
| Type |
|
||||||||||||||||||||||||
| Compare Networks/Symbol Tables reports only: | |||||||||||||||||||||||||
| Show |
|
||||||||||||||||||||||||
| Accounting Information/Schedule of Jobs reports only: | |||||||||||||||||||||||||
| Step | (Applies to z/OS only.)
Job step. Step data is only collected if the Collect z/OS step accounting data option is enabled in the Entire Operations default settings: see Defaults for Operating System Specials in the Administration documentation. |
||||||||||||||||||||||||
| JobID | Job identifier as assigned by the operating system. | ||||||||||||||||||||||||
| Start | Start date/time of the job. | ||||||||||||||||||||||||
| Stop | End date/time of job. | ||||||||||||||||||||||||
| Elapsed min
or Elapsed Time |
Estimated run time (in minutes) of the
job.
BS2000: Since the BS2000 LOGOFF message does not contain seconds, the elapsed time cannot be calculated exactly. |
||||||||||||||||||||||||
| CPU Time sec | Estimated CPU time (in seconds) of the job.
UNIX: CPU time information is written to the SYSOUT of UNIX
jobs. For this purpose, the shell Example: %% EOR0303 - times - Begin 0m0.121s 0m0.025s 0m0.043s 0m0.066s %% EOR0304 - times - End Notes:
|
||||||||||||||||||||||||
date
to date
are |
Line below the report table indicating the average CPU consumption. Average values of all elapsed and CPU times for all jobs in the network. |
||||||||||||||||||||||||
| Network/Job Usage reports only: | |||||||||||||||||||||||||
| Used Job | Networks and jobs used by single or multiple jobs. | ||||||||||||||||||||||||
| Using Job | Networks and jobs using a job as a
subnetwork (job type NET), an End-of-Job (EOJ) action or a
recovery job.
|
||||||||||||||||||||||||
| Usage | Indicates the job use:
Subnet, EOJ Activation or
Recovery.
|
||||||||||||||||||||||||
| Activation Mode | Activation mode defined for the
subnetwork.
See also Time of Activation of a Subnetwork in the System Overview. |
||||||||||||||||||||||||
| Node Overview reports only: | |||||||||||||||||||||||||
| Server Name | For mainframe nodes: a descriptive name.
For UNIX and Windows nodes: the name of the EntireX Broker service. |
||||||||||||||||||||||||
| Node Range | Range of node numbers from 1 to 99900. | ||||||||||||||||||||||||
| Short | Short name of a node. | ||||||||||||||||||||||||
| AM |
|
||||||||||||||||||||||||
| Op. Sys. | Operating system under which the node is
running as received from the last SYSTEM-INFO call to Entire
System Server or UNIX/Windows system information.
|
||||||||||||||||||||||||
| Wait a. Error | Wait time after error.
Time in minutes to wait until next node access after a temporary error. |
||||||||||||||||||||||||
| VSE SysId | SYSID defined for a z/VSE node is added to the JCL of jobs submitted on this node. | ||||||||||||||||||||||||
| SSU | Submit Security User Type.
If empty, the system-wide default is in effect for this node. |
||||||||||||||||||||||||
| Time Diff. | Time difference between local time and GMT in hours if node is in a different time zone. | ||||||||||||||||||||||||
| Valid |
|
||||||||||||||||||||||||
| NPR Version | Current Entire System Server version of the node. | ||||||||||||||||||||||||
| OS Release | Information about the operating system (where available). | ||||||||||||||||||||||||
| Bar Chart reports only: | |||||||||||||||||||||||||
| Run | Run number of the job. | ||||||||||||||||||||||||
| Activation Time | Date/time when the job is activated. | ||||||||||||||||||||||||
| Start time | Date/time when the job started. | ||||||||||||||||||||||||
| Stop Time | Date/time when the job stopped. | ||||||||||||||||||||||||
| Elapsed Time | Elapsed time (between job start time and job stop). | ||||||||||||||||||||||||
| Minimum/Maximum Elapsed Time | Minimum or maximum elapsed time per job run. | ||||||||||||||||||||||||
| CPU Time | CPU time in milliseconds (ms). | ||||||||||||||||||||||||
| Stop Job | Last executed job. | ||||||||||||||||||||||||
| Stop Message | Message of the last executed job. | ||||||||||||||||||||||||
| Run OK? | Is true if the networks finished without errors. | ||||||||||||||||||||||||
If indicated in the table above, you can use an asterisk
(*) or a smaller/greater than (< or
>) wildcard character to determine a start or an end value (see
also Valid Name
Specifications in Direct Commands) or
open a selection list of names.
The use of asterisk/wildcard report selection can be disallowed for non-administrator users (see User Definitions and Profile Settings in the Administration documentation).
By default, users of type A (system administrator) and O (operator) are allowed to use asterisk/wildcard selection; users of type G (general user) are not. It is not possible to disallow it for users of type A.
Report data is evaluated for the current day by default. This evaluation date needs to be considered, in particular, when you maintain different versions of networks and symbol tables with either fix versions or versions dynamically loaded on this date.
The determination date can also affect named filters that
use the selection criterion (current): see
Filtering Objects and
Changes to the
Determination Date.
You can specify the date for which a report (or a named filter
with (current)) evaluates the data to be generated.
To set the determination date
Select the General node.
Open the context menu and select Determination Date.
A Determination Date window similar to the example below opens:
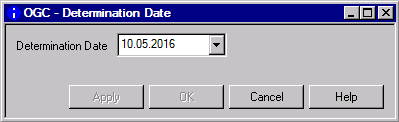
Open the drop-down list box and select the required date from a calendar.
Or:
Type the required date in the input box.
Choose to save the date.
The Save as File dialog specifies the format for the report and the location where the report is written.
| Field | Explanation |
|---|---|
| File type | The format used for report generation:
|
| File name | The name to be used for the report
file.
If no path is specified in the File name field, the file will be saved at: %LOCALAPPDATA%\Software AG\Natural\ |
| Open with external application | If this option is checked (default setting), the default Windows application associated with the specific file extension opens. |
The settings in the Save as File dialog are stored between sessions in a client-specific XML profile and are used as the default value for the next Save as File operation on a report of the same report type.
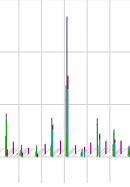
The report types Network Start Overview (Bar Chart), Network and Job Start Overview (Bar Chart) and Network Schedule Overview (Bar Chart) generate the usual report columns but additionally provide an interactive diagram with a bar chart for better data visualization.
Bar charts of the report types visualize report column data as an interactive diagram. Bar charts are useful for overviewing the job flow and finding out the peak and off-peak times to balance the workload (CPU load) among the different networks.
Bar charts reports are not static but have interactive elements which are described in the following section:
You can collapse the filter area by clicking on the arrow:
![]()
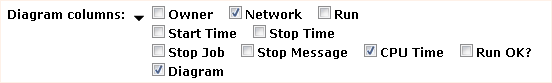
Depending on the diagram columns you select, different columns of the report are shown:
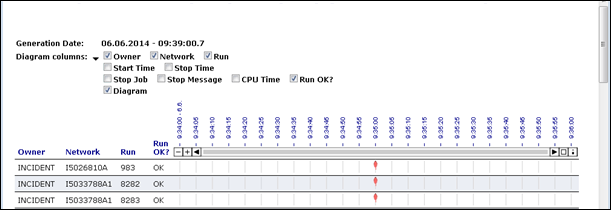
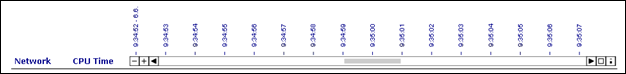
If you select part of the time table as shown below,
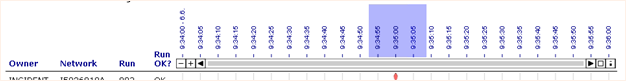
the diagram is zoomed in so you can view more details:
| Symbol | Explanation |
|---|---|
|
|
Zooms the diagram out (-) or in (+). |
|
|
Scrolls left or right in the diagram. |
|
|
Shows the complete diagram. |
|
|
Shows further information/explanations. |
If you move the mouse over the marker, you can view further information such as start and/or end times:
![]()
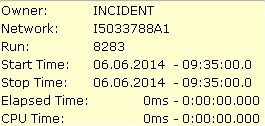
If you move the mouse over a bar, you can view additional information about the given network:
The report types Monitor Tasks and Functions Overview and Monitor Tasks and Exits Overview provide an interactive diagram with a bar chart and features to filter information as described in the following section.
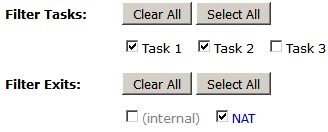
You can unmark or mark the items to deselect or select the items to be shown in the diagram.
You can choose Clear All or Select All to deselect or select all items marked in the Tasks, Exits and/or Functions rows.
If you select part of the time table as shown below,

the diagram
is zoomed in so you can view more details:

| Symbol | Explanation |
|---|---|
|
|
Zooms the diagram out (-) or in (+). |
|
|
Scrolls left or right in the diagram. |
|
|
Shows the complete diagram. |
If you move the mouse over the top of a bar graph in the diagram, you can view additional information such as the execution time, average execution time and the number of calls, for example:
Administrator users (and reports run in batch) may report on any network in any owner. Non-administrator users, however, will only receive information on networks to which they have read access. A user is considered to have read access if:
The user is linked to owner SYSDBA.
The user is linked to the network owner.
Access to the network has been explicitly granted to the user.
User authorization for performing report functions are granted in the default user profile as described in Reporting Functions in the Administration documentation.
Data generated for a report from Entire Operations GUI Client is retained for the number of days specified for active jobs in the Retention Periods of the Entire Operations default settings (see Defaults for Time Ranges in the Administration documentation).
Older reports listed in the Reporting window of Entire Operations GUI Client are automatically removed after this period or during the next database cleanup (see also the Administration documentation).
This section contains examples of all types of reports you can generate with the Reporting function:
The following is an example of the report type Log - Terminated Jobs:
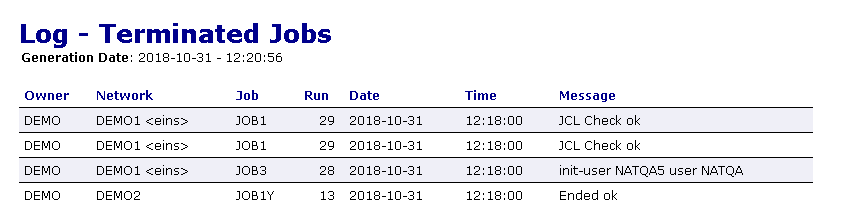
The columns contained in the report are described in Fields and Columns: Reports.
The following is an example of the report type Log - Abended Jobs:
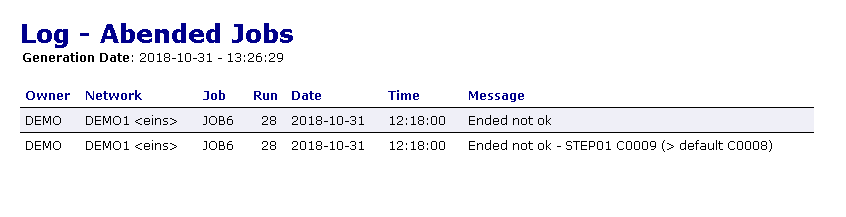
The columns contained in the report are described in Fields and Columns: Reports.
The following is an example of the report type Log - Jobs not started:
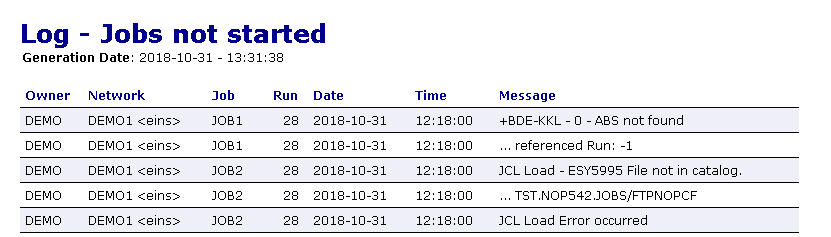
The columns contained in the report are described in Fields and Columns: Reports.
The following is an example of the report type Log - Jobs with permanent errors:
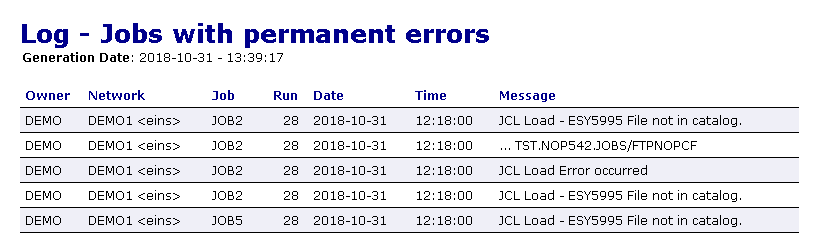
The columns contained in the report are described in Fields and Columns: Reports.
The following is an example of a Log – Networks not activated report:
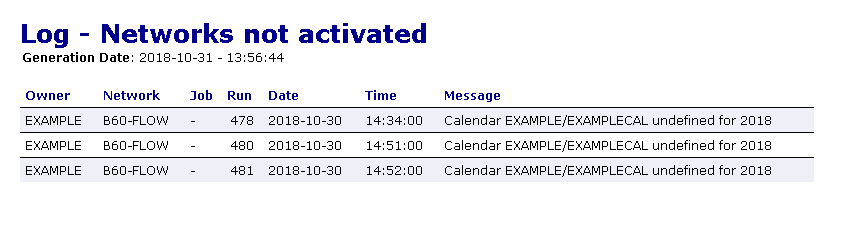
The columns contained in the report are described in Fields and Columns: Reports.
The following is an example of the report type Accounting Information:
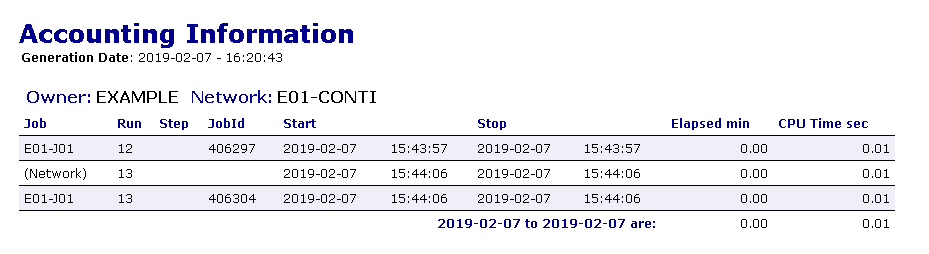
The columns contained in the report are described under Accounting Information/Schedule of Jobs reports only in Fields and Columns: Reports.
The following is an example of the report type Network Description (short):
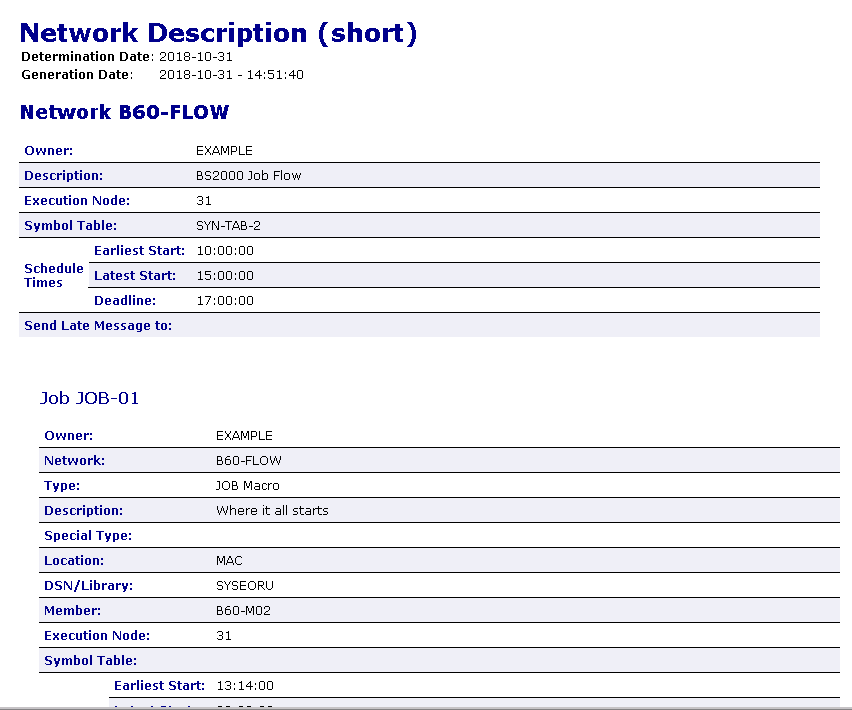
The fields contained in the report are described in Fields and Columns: Reports.
The following is an example of the report type Schedule of Jobs:
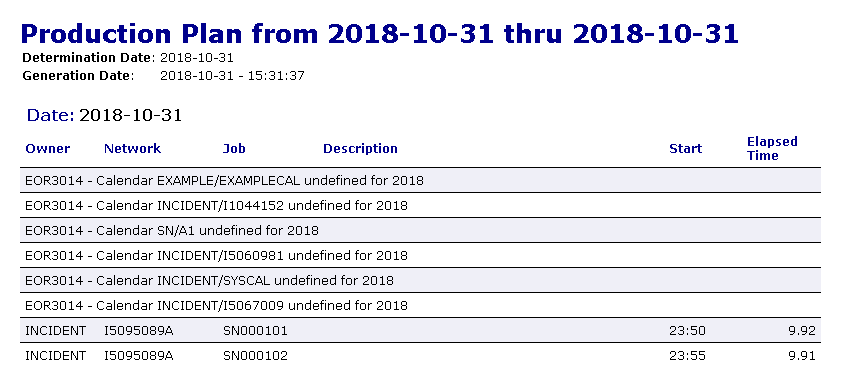
The columns contained in the report are described under Accounting Information/Schedule of Jobs reports only in Fields and Columns: Reports.
The following is an example of the report type Network Start Summary:
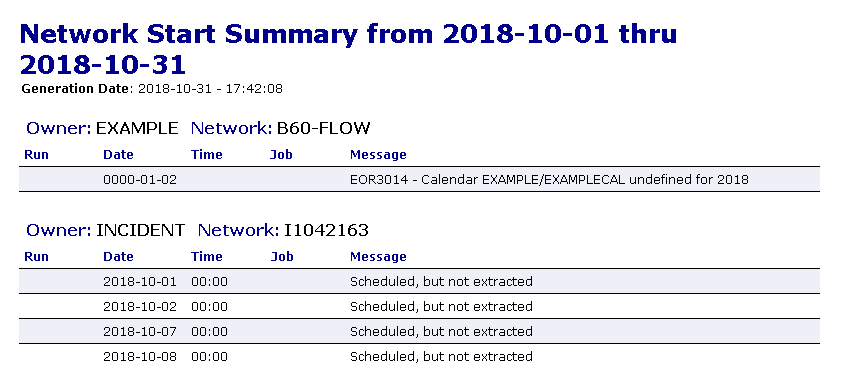
The columns contained in the report are described in Fields and Columns: Reports.
The following is an example of the report type Network Schedule Overview:
The columns contained in the report are described in Fields and Columns: Reports.
The following is an example of the report type Activation Overview:
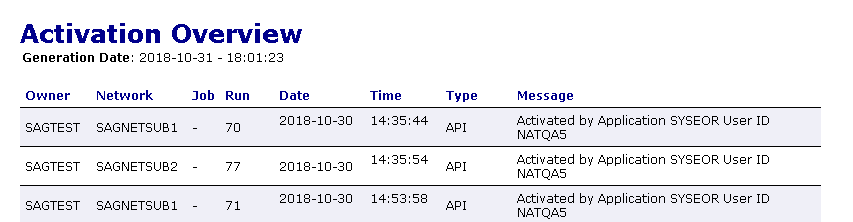
The columns contained in the report are described in Fields and Columns: Reports.
The following is an example of the report type Compare Symbol Tables:
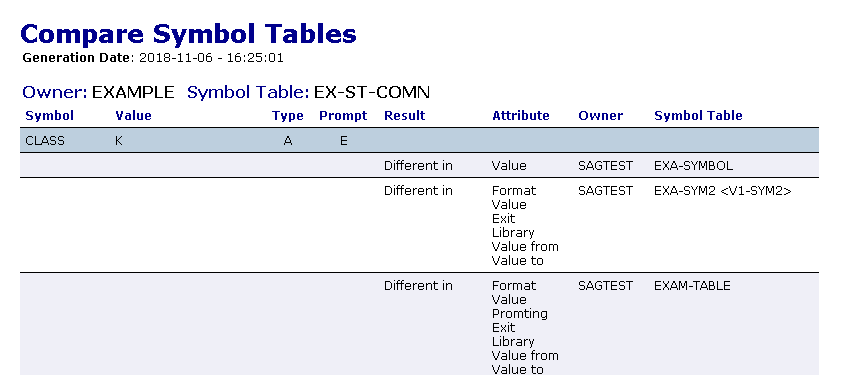
The columns contained in the report are described under Compare Networks/Symbol Tables reports only in Fields and Columns: Reports.
The following is an example of the report type Compare Networks:
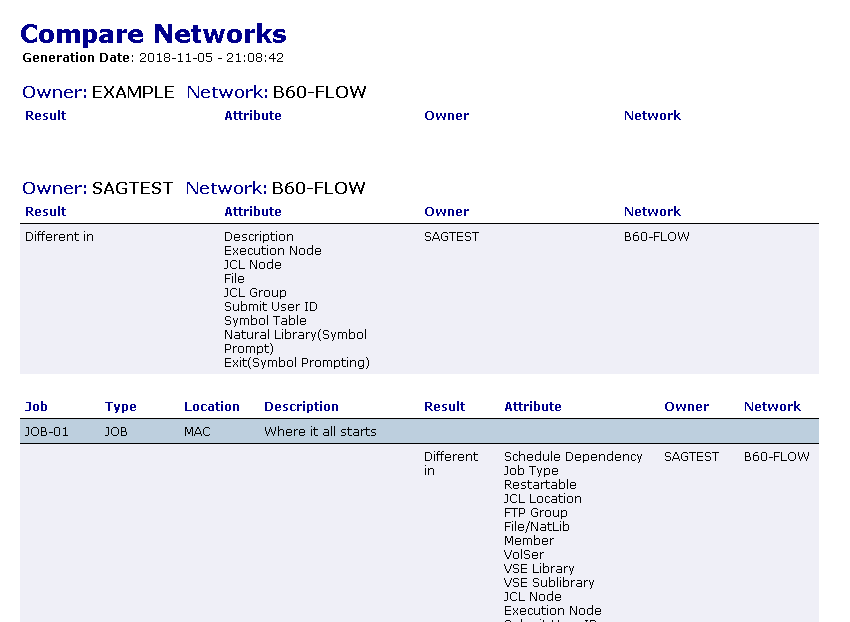
The columns contained in the report are described under Compare Networks/Symbol Tables reports only in Fields and Columns: Reports.
The following is an example of the report type Node Overview:
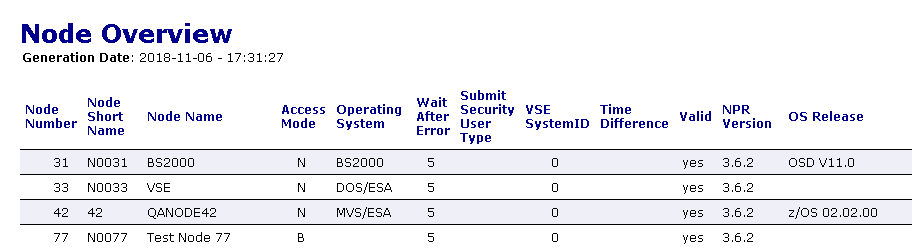
The columns contained in the report are described under Node Overview reports only in Fields and Columns: Reports.
The following is an example of the report type Network/Job Usage:
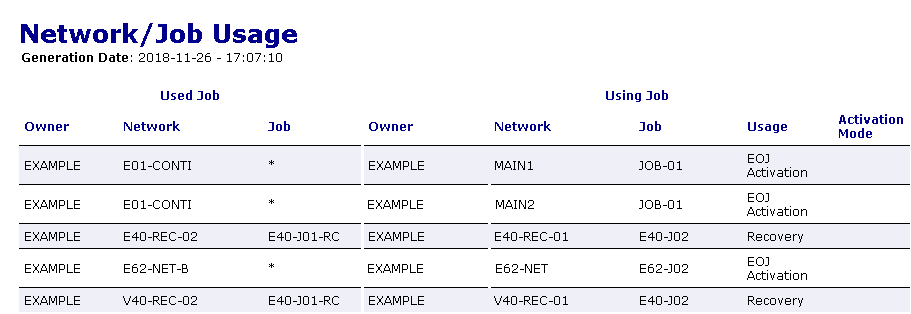
The columns contained in the report are described under Network/Job Usage reports only in Fields and Columns: Reports.
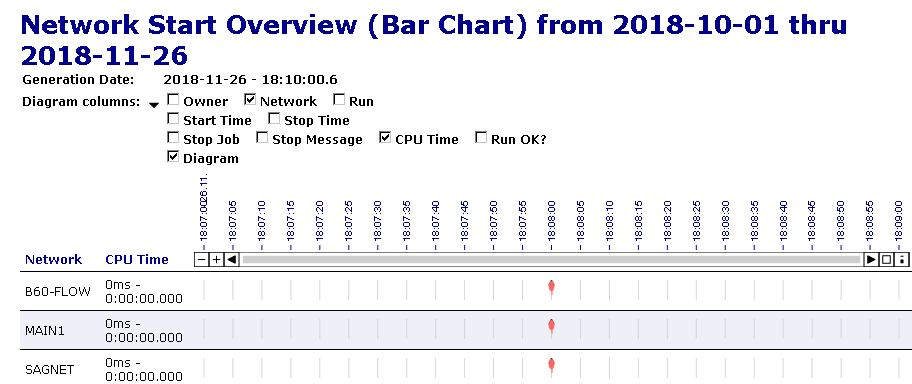
The following is an example of the report type Example of Network Start Overview (Bar Chart):
The columns contained in the report are described under Bar Chart reports only in Fields and Columns: Reports.
See also the section Using Reports with Bar Charts for information on how to handle bar charts.
The following is an example of the report type Network and Job Start Overview (Bar Chart):
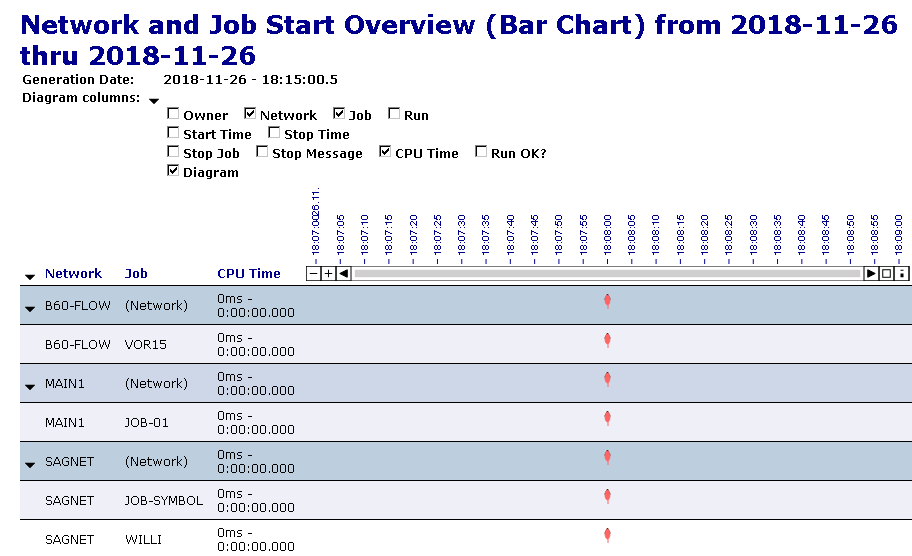
The columns contained in the report are described under Bar Chart reports only in Fields and Columns: Reports.
See also the section Using Reports with Bar Charts for information on how to handle bar charts.
The following is an example of the report type Network Schedule Overview (Bar Chart):
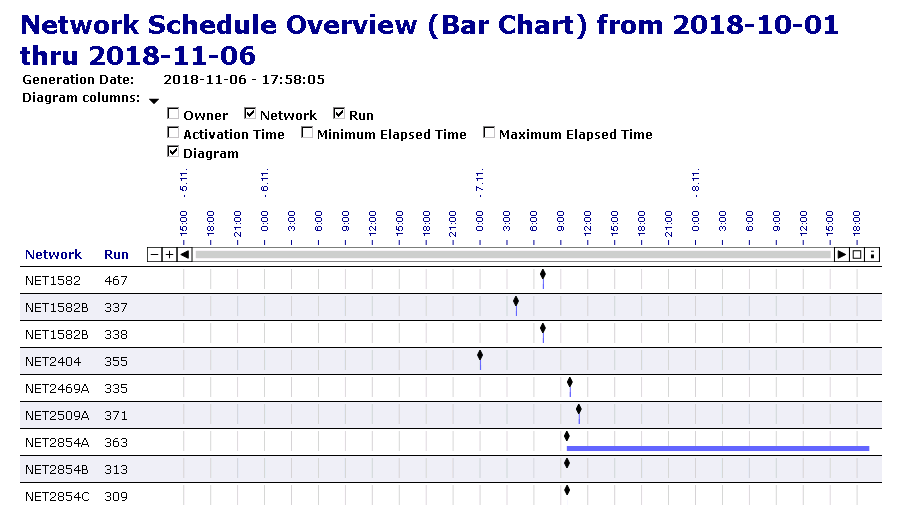
The columns contained in the report are described under Bar Chart reports only in Fields and Columns: Reports.
See also the section Using Reports with Bar Charts for information on how to handle bar charts.
The following is an example of the report type Monitor Tasks and Exits Overview:
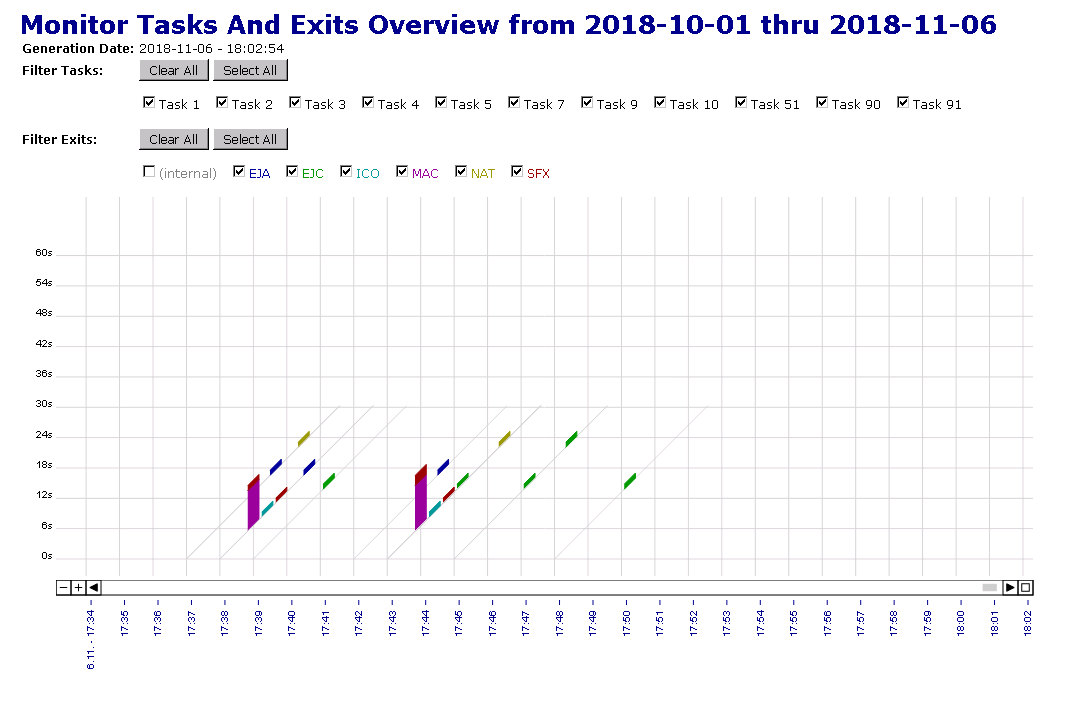
See also the section Using Reports with Monitor Task Time Tables for information on how to handle task time tables.
The following is an example of the report type Monitor Tasks and Functions Overview:
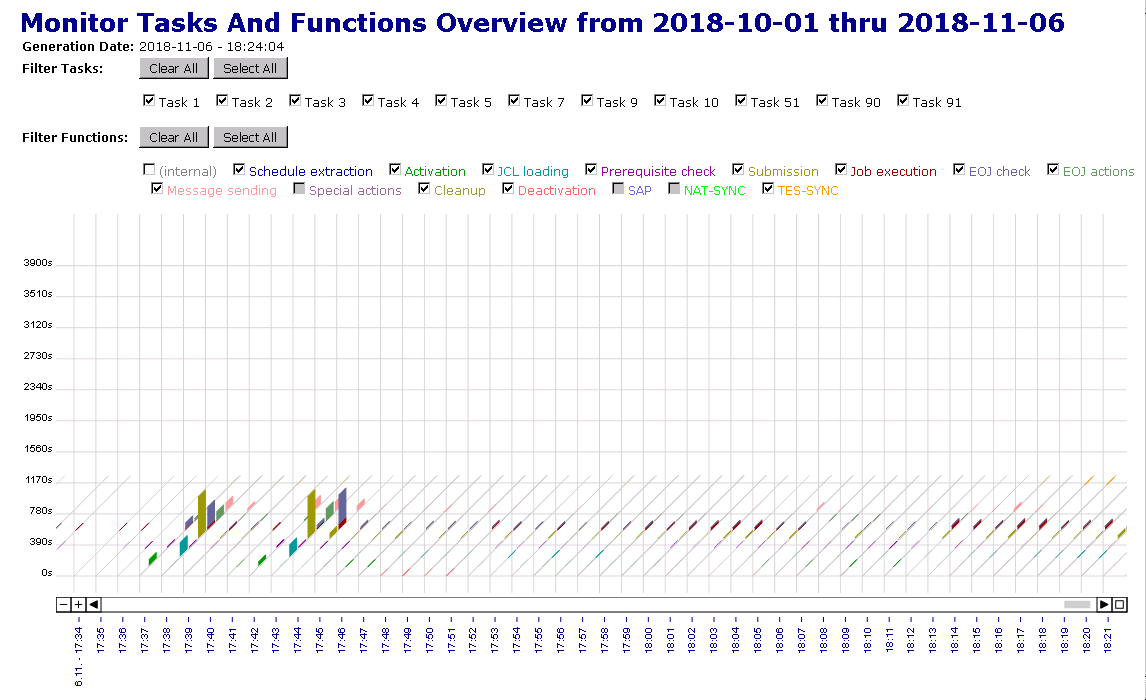
See also the section Using Reports with Monitor Task Time Tables for information on how to handle task time tables.
You can use the batch command client of Entire Systems Management to generate a report in batch mode: see Commands for the Batch Command Client in the section Using Entire Operations in Batch Mode.


