
The Entire Operations Monitor is the basic operational component Entire Operations requires to maintain job networks.
For details, see Entire Operations Monitor in the Concepts and Facilities documentation.
This document covers the following topics:
 To control the Entire Operations Monitor and display status
information
To control the Entire Operations Monitor and display status
information
In the object workspace, select the General node and choose Monitor Status from the context menu.
Or:
Use the direct command
STATUS
as described in the Direct Commands documentation.
If required, a Logon Node window prompts you to logon to the specified node (see Logon Function in the User's Guide).
Enter your credentials and choose OK.
A Monitor Status window similar to the example below opens:
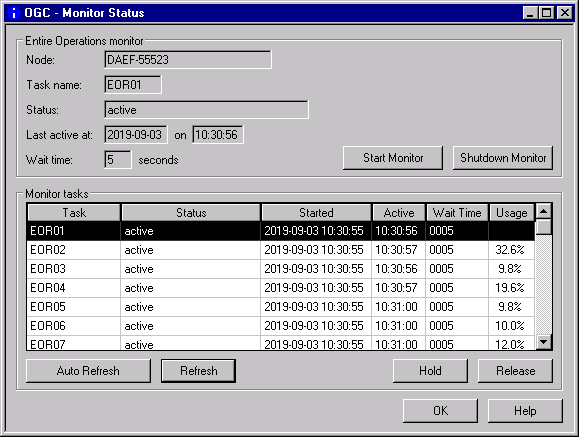
If tasks have been defined for the Monitor (see Defining a Monitor Task Profile), these tasks are listed in the Monitor tasks section of the window. The columns in this section are explained in Columns: Monitor Tasks.
The fields in the upper half of the window are explained in Monitor Status.
This section covers the following topics:
The fields in the upper half of the Monitor Status window are explained in the following table:
| Field | Meaning | |
|---|---|---|
| Task Name | Name of the Monitor
main task. The syntax (explained in
Direct
Command Syntax) is as follows:
{task-prefix}{task-number} Example:
If the task prefix is For further information, see also Monitor Task Prefix. |
|
| Status | Protected field showing the current status of the Entire Operations Monitor. | |
| Last active at | Date and time of the
last Monitor activity.
See also Date and Time Formats in the User's Guide. |
|
| Wait Time | Interval between Entire
Operations Monitor working cycles in seconds.
When you start the Monitor, the value is taken from the Global Monitor Wait Time defined in the Monitor Defaults. |
|
The columns in the Monitor tasks section of the Monitor Status window are explained in the following section.
| Column | Meaning |
|---|---|
| Task | Name of the Monitor
(sub)task.
For further information, see also Task Name. |
| Status | Status of the
(sub)task.
If the Monitor is executed on UNIX or Windows, the status text may be followed by the process ID of the Monitor task. Example:
|
| Started | Time at which the task was started. |
| Active | Time of the last activity. |
| Wait Time | Active Monitor task
wait time.
This value is modifiable. It can be defined individually for each Monitor task. Values changed here are in effect for the current Monitor session only. The value Global Monitor Wait Time from the Monitor Defaults will be used if no value is specified here. For details, see Monitor Defaults. The default wait time modification (for all Monitor sessions) is described in Fields: Monitor Defaults - Monitor Task Profile. |
| Usage | Percentage of task activity within real time, calculated from the task start or from the last task reconfiguration. |
The functions available in the Monitor Status window are explained in the following table:
| Function | Meaning | |
|---|---|---|
| Start Monitor | Start the Monitor.
Delay before a Monitor restart: Any Monitor restart which will be performed earlier than Monitor termination time plus three (3) times the Monitor wait time is assumed to be a duplicate Monitor (task) start. Avoid restarting the Monitor within this time interval. |
|
| Shutdown Monitor | Shut down the Monitor. No data is lost. | |
| Auto Refresh | Switch on/off automatic
refresh of the Monitor tasks list after a specified time
interval.
See also Refreshing Object Lists in the User's Guide. |
|
| Refresh | Refresh the
Monitor tasks list.
See also Refreshing Object Lists in the User's Guide. |
|
| Hold | Hold a selected Monitor task. | |
| Release | Release a selected Monitor task. | |
For a description of how to customize the Monitor tasks, see the section Defining a Monitor Task Profile.