The SYSRDC utility is used to record monitoring and accounting data on the internal process flow within a Natural application. This data can be used for evaluating Natural session activities in external or Natural programs. The data is collected at events performed within Natural.
The SYSRDC Utility documentation covers the following topics:
See also the documentation on the Profiler Utility, a menu-driven tool for generating and listing trace records.
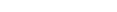
This section describes the components the SYSRDC utility provides in order to collect data and supply it for further processing.
Natural Data Collector as part of the Natural nucleus:
Collects data and controls data recording in the Natural Data
Collector buffer.
User exits:
Passes data to external monitoring and accounting programs.
CMRDC interface:
Evaluates data in a Natural program for the current Natural
session.
Events specify activities within Natural. The table below lists the events at which data is collected within Natural and the types of event available.
Each type of event is assigned a one- or two-letter code where the first letter represents the group of event and any second letter the subtype.
For example, in the event type PL, P represents the event group "program" and L the subtype "load".
| Event | Event Type |
|---|---|
| Session initialization. | SI |
| Session termination. | ST |
| Program load. | PL |
| Program start. | PS |
| Program termination. | PT |
| Before database call. | DB |
| After database call. | DA |
| Before terminal I/O. | IB |
| After a terminal I/O. | IA |
| Before non-Natural program call. | CB |
| After non-Natural program call. | CA |
| Runtime error. | E |
| Internal trace call.
Anmerkung: |
N |
| Natural statement.
Anmerkung: |
NS |
| Outbound RPC message. | RO |
| Inbound RPC message. | RI |
| Start of RPC request execution. | RS |
| Wait for RPC client request | RW |
| User-defined event. | U |
 To activate an internal trace call event
Set the Natural profile parameter
ITRACE=ON.
Define the Natural components that are to issue internal trace calls:
By using the NTTRACE macro of the Natural parameter module.
Or, by setting the dynamic Natural profile parameter TRACE.
To activate a Natural statement event
Set Natural profile parameter ITRACE=ON and
TRACE=NATPROX.
The NTTRACE macro and the parameters ITRACE and TRACE are described in the Parameter Reference documentation.
The data the Natural Data Collector collects at events are described in the following section.
For the layout of the data, see the Natural source data set (file) NAMRDC, or the local data area RDCDATA that is provided in the Natural system library SYSRDC.
The data collected can be split into two categories: general and event-specific data:
The following general data is collected at every event:
Software AG product name
Product version
Operating system
TP monitor
Run modes, such as addressing or residence mode of the Natural nucleus and the buffer pool
TP user or batch job name
TP terminal ID
Current Natural user ID
Current Natural Security user group ID
Current Natural library
Current Natural program
Current program level
Line number of program statement currently executed
session CPU time (same format as *CPU-TIME)
The following data is only collected at the following events:
| Event | Data Elements |
|---|---|
| Session initialization | none |
| Session termination |
Termination return code |
| Program load |
Name of program to be loaded |
| Program start/termination |
Program type |
| Database call |
Database type |
| Terminal I/O |
Number of bytes sent |
| Non-Natural program call |
Name of program called |
| Runtime error |
Natural system error message code |
| Internal trace call |
Up to 250 bytes of information on Natural nucleus
components |
| Natural statement | Up to 250 bytes of information on performed Natural statements |
| RPC request | RPC-specific information:
Environment: C = client, S = server.
RDC subtype S:
RDC subtypes O, I and W: |
| User-defined event | Up to 250 bytes of user-defined information |
The Natural Data Collector is activated and controlled by the Natural profile parameter RDC (see also the relevant section in the Parameter Reference documentation).
By default, the parameter is set to RDC=OFF,
which means that the Natural Data Collector is deactivated and trace recording
must be activated separately. To alter settings, use the
NTRDC
macro described in the RDC entry in Parameter
Reference.
The following values and keyword subparameters are available for the profile parameter RDC:
| Value/Subparameter | Description |
|---|---|
| ON | With ON, the trace recording is
started automatically during Natural session start.
|
| OFF | Natural Data Collector is deactivated and trace recording must be activated separately. |
| EVENT | Specify events to be recorded. Specify
ALL to record all events. See
EVENT - Natural Data
Collector Events to be Recorded.
Anmerkung: |
| EXIT | Define user exits; see EXIT - Define Natural Data Collector User Exits. |
| FNAT | Control trace recording while Natural system file programs are executing. See FNAT - Trace Recording in the Natural System File. |
| SIZE | Specify the buffer size for the Natural Data
Collector. In addition, it controls the trace recording function of the Natural
Data Collector. See SIZE -
Size of the Natural Data Collector Buffer.
Anmerkung: |
The event data collected is always supplied to user exits to be used by external monitoring/accounting programs as described in the relevant section. Independently of the user exists, you can record the event data of the current Natural session in the Natural Data Collector buffer. This can be useful for testing purposes. In this section, the recording of data in the Natural Data Collector buffer is referred to as trace recording.
By default, trace recording is not active when you start a session. To
make trace recording being activated when starting a session, set
RDC=ON, see RDC - Configure the Natural Data
Collector. As a prerequisite, the RDC subparameter SIZE
must be set to a value greater than 2. You can also enter one of the following
commands to start trace recording:
system command RDC ON
terminal command %<RDC+
Natural statement CALL 'CMRDC' 'S'
Anmerkungen:
FNAT=ON.
Trace recording ends:
system command RDC OFF
terminal command %<RDC-
Natural statement CALL 'CMRDC' 'P'
when a session is terminated
The event data can be passed to external monitoring and accounting programs for evaluation of activities in Natural sessions. This is accomplished with the user exits and the examples of user-exit programs provided. User-exit programs are written in assembly language.
The Natural Data Collector supports any number of user exits. A user exit can be defined by the Natural profile parameter RDCEXIT (see the relevant section in the Parameter Reference documentation). An external monitoring/accounting program can be attached to each user exit.
Three exit names are predefined: RDCEX1, RDCEX2 and RDCEX3. If you use one of these names as entry point for your exit (which is linked to the Natural nucleus), the Natural profile parameter RDCEXIT is not required.
At every event listed under Data-Collecting Events, the user exits take over control by using the standard linkage call conventions described in the table below:
| Register | Contents |
|---|---|
| 1 | Points to a parameter address list that consists of two addresses: one address points to the general data and the other points to event-specific data. The layout of these areas is mapped by the DSECT RDCGDATA and RDCLDATA respectively. Both DSECTs are supplied in source form in the Natural macro NAMRDC. |
| 13 | Points to a 72-byte standard save area. |
| 14 | Contains the return address. |
| 15 | Contains either the entry point address or the return code of the user exit. |
Anmerkung:
The user exits are called independently of the CMRDC
interface.
A user-exit program must have the same attributes as Natural; that is, it must have the same addressing mode, and it has to be reentrant. It must be linked with the Natural nucleus according to the conventions of statically linked non-Natural programs. See also the profile parameters CSTATIC and RCA described in the Parameter Reference documentation.
By default, a 400-byte exclusive work area (per session) is supplied for each user exit (the field RDCGWRKA). If a larger work area is required for a user exit, it can be specified after the user-exit name in the Natural profile parameter RDCEXIT (see the relevant section in the Parameter Reference documentation). The work-area length is passed on to the user exits in the field RDCGWRKL and can be used for verification. The location of this work area can change during a session due to Natural relocation, but its contents are preserved.
In TP-monitor environments, the TP anchor address is supplied (the field RDCGANCH); for example, the CSA address under CICS. It can be used to access system information.
If a Program Check occurs during the execution of a user-exit program, further data collecting is disabled for the rest of the session to avoid recursive abend situations.
The section below contains information on:
Non-zero return codes are only supported for two events:
Before a database call, where Register 15 can contain an Adabas response code, which is stored in the control block; the Adabas call will not be executed.
At program start, where Register 15 can contain a Natural error message code; the program will not be executed, but an error condition will occur with the specified number.
The following examples of user-exit programs are provided in the following Natural source data sets (files):
| Program | Data Set (File) | Used for |
|---|---|---|
| NAMRDC | NATnnn.SRCE | DSECT macro for general and event-specific data |
| XNATRDC1 | NATnnn.SRCE | Natural TSO Interface and Natural batch interface under operating systems z/OS and z/VSE |
| XNCFRDC1 | NCFnnn.SRCE | Com-plete |
| XNCIRDC1 | NCInnn.SRCE | Natural CICS Interface |
The CMRDC application programming interface is used for retrieving and controlling the trace data recorded in the Natural Data Collector buffer. This can be useful for testing purposes.
To invoke the CMRDC interface
In the Natural program, issue a CALL statement.
The functions provided by the CMRDC interface and the syntax that applies to the corresponding Natural CALL statements are described in the following section.
In addition, the Natural system library SYSRDC provides example programs and the appropriate local data area RDCDATA in which the structure of trace records is defined. Acording to this definition, a trace record has two main components: one to cover general data and one to cover event specific data.
The section below contains information on:
To read the data from the Natural Data Collector buffer, invoke CMRDC with the following Natural statement:
CALL 'CMRDC'
function event-time gen-data event-data
seq.-number |
The following parameters are passed:
| Parameter | Format/Length | Explanation | ||||||
|---|---|---|---|---|---|---|---|---|
| function | A1 |
|
||||||
| event-time |
N10 |
Time of event The time is passed back in either of the following formats:
|
||||||
| gen-data | A252 | General data (field GDATA)
|
||||||
| event-data | A252 | Event-specific data (field LDATA)
|
||||||
| seq.-number | I4 | Sequence number of record
Only applies to Function N (see above). |
The retrieval functions stop recording data in the Natural Data Collector buffer implicitly.
To stop or restart trace recording data in the Natural Data Collector buffer, invoke CMRDC with the following statement:
CALL 'CMRDC'
function |
The following parameter is passed:
| Parameter | Format/Length | Explanation | ||||
|---|---|---|---|---|---|---|
| function | A1 |
|
By default, all events are selected for trace recording. Use this function if you wish only specific events to be recorded.
Anmerkungen:
To select the types of event to be recorded, invoke CMRDC with the following statement:
CALL 'CMRDC'
function type ... |
The following parameters are passed:
| Parameter | Format/Length | Explanation | ||||||
|---|---|---|---|---|---|---|---|---|
| function | A1 |
|
||||||
| type | A1, A2 or A3 |
The one- or two-letter code for the event type to be recorded as listed in Data-Collecting Events. Specify any number of parameters for the event types desired. Alternatively, you can select a range of events or no event:
|
To specify a user-defined event, invoke CMRDC with the following statement:
CALL 'CMRDC'
function record |
The following parameters are passed:
| Parameter | Format/Length | Explanation | ||
|---|---|---|---|---|
| function | A1 |
|
||
| record | Annn | Trace record with a length (nnn) of up to 250 bytes |
To retrieve the trace status and the event types currently set, invoke CMRDC with the following statement:
CALL 'CMRDC'
function status types |
The following parameters are passed:
| Parameter | Format/Length | Explanation | ||||
|---|---|---|---|---|---|---|
| function | A1 |
|
||||
| status | A1 |
Current trace status:
|
||||
| types | Ann |
The two-letter codes for the event types currently set; see Selecting Event Types for Trace Recording. The variable types requires a minimum length (nn) of 64 bytes to provide sufficient space for all event types. This parameter is optional. |
| Code | Meaning |
|---|---|
| 0 | Function executed successfully. |
| 4 |
Last trace record. If event type is 0, there is no trace data
for function F. |
| 8 | Too few parameters for this function. |
| 12 | Invalid function code. |
| 16 | Natural Data Collector not active, for example, RDCSIZE=0. |
| 20 | Natural Data Collector disabled after an error. |
| 24 | No buffer space available for trace recording (RDCSIZE=2). |
| 28 |
Invalid parameter value. |
The Natural system library SYSRDC contains the following example programs:
| Program | Function |
|---|---|
| RDCDISP | Display all records in the Natural Data Collector buffer and show the fields as specified in the program. See also Example Output of Program RDCDISP below. |
| RDCSTART | Restart trace recording. |
| RDCSTOP | Stop trace recording. |
| RDCSET | Select events for trace recording. |
| RDCUSER | User-defined event. |
| RDCSTAT | Retrieve trace status. |
| RDCDISIO | Display all I/O-related records in the Natural Data Collector buffer and show the fields as specified in the program. See also Internal Validity Check and Tracing for I/O-related Statements and Example Output of Program RDCDISIO. |
The example screen below shows the extract of an output report produced by the example program RDCDISP.
ETIME1 TY GCUID LV GPGM T GCAPL PRLIB PRNAM CO DB FN RC --------- -- -------- -- -------- - -------- -------- -------- -- ---- ---- --- 0.0000 SI SAG SYSTEM 0.0002 DB SAG SYSTEM OP 10 0.0002 DA SAG SYSTEM OP 10 0.0000 DB SAG SYSTEM S1 10 1640 0.0005 DA SAG SYSTEM S1 10 1640 0.0001 PL SAG SYSTEM SYSLIB MAINMENU 0.0001 PS SAG 1 MAINMENU F SYSTEM SYSLIB MAINMENU 10 1640 0.0001 PL SAG 1 MAINMENU SYSTEM SYSLIB NAT00029 0.0000 DB SAG 1 MAINMENU SYSTEM S1 10 1640 0.0002 DA SAG 1 MAINMENU SYSTEM S1 10 1640 0.0000 PS SAG 2 NAT00029 N SYSTEM SYSLIBS NAT00029 10 1640 0.0000 CB SAG 2 NAT00029 SYSTEM CMMPP S 0.0000 CA SAG 2 NAT00029 SYSTEM CMMPP S 0.0000 PT SAG 2 NAT00029 N SYSTEM SYSLIBS NAT00029 0.0000 PL SAG 1 MAINMENU SYSTEM SYSLIB USR2003P 0.0000 PS SAG 2 USR2003P N SYSTEM SYSLIB USR2003P 10 1640 0.0001 PT SAG 2 USR2003P N SYSTEM SYSLIB USR2003P 0.0000 CB SAG 1 MAINMENU SYSTEM CMUB S |
The following table describes the columns that are displayed on the example screen, and the variables to which they refer. For some events the data displayed PRLIB etc. has a different meaning. For further information, see the comments in the program source and the local data area RDCDATA. For an explanation of the Natural system variables mentioned, refer to the System Variables documentation.
| Column | Explanation |
|---|---|
| ETIME1 | Time interval in seconds between the execution of the current and the previous event. |
| TY | Type of event as listed in Data-Collecting Events. |
| GCUID | Current Natural user ID as assigned by the Natural system
variable *USER.
|
| LV | Program level. |
| GPGM | Name of the current program as assigned by the Natural system
variable *PROGRAM.
|
| T | Type of program. |
| GCAPL | ID of the current application library as assigned by the
Natural system variable *APPLIC-ID.
|
| PRLIB |
ID of the library where the program is stored. |
| PRNAM | Name of the program to be loaded for the type of event. |
| CO | Database command. |
| DB | Database ID. |
| FN | File number of database. |
| RC | Database or program call response code. |
To detect NAT1132
errors and to facilitate debugging, information relevant to the error type
(such as lengths of lines and fields, or buffer offsets) can be collected by
trace recording. After
processing an I/O statement (such as WRITE and
DISPLAY) a validation routine is executed to check the buffers
IOPAGE and IOPATTR for validity and consistency, for
example with respect to presence of a line separator. If a potential error is
detected, a message (NAT1132 condition detected) is
written to the Natural Data Collector buffer, together with information that
helps to locate the error, and trace recording is stopped to avoid this result
to be hidden by subsequent irrelevant data.
To activate NAT1132 trace recording, specify the following Natural profile parameters:
ITRACE=ON,RDCSIZE=128,TRACE=IO |
If a trace was created for a program that you have run, you can display
I/O-related records by executing RDCDISIO in system library
SYSRDC.
The following screen shows (a fragment of) a trace report produced by
the program RDCDISIO:
GCUID LV GPGM GCAPL NDATA -------- -- -------- -------- --------------------------------------------- MK 1 LOGON SYSTEM INO2 08 F 005041700618 (R6) MK 1 MYDEMO MK INO2 00 F 001A00200609 (R6) MK 1 MYDEMO MK IOIPR F 001A00200609 50 50 0050 0050 MK 1 MYDEMO MK INO2 04 F 001A00200609 (R6) MK 1 MYDEMO MK INO2 00 F 001A00200609 (R6) MK 1 MYDEMO MK IOIPR F 001A00200609 50 50 0050 0050 MK 1 MYDEMO MK INO2 F 10C000C8C9C5 (R6) BEG OF IOPRI MK 1 MYDEMO MK IOEUP F 000000A0 0F (PATTRADF/LNG) MK 1 MYDEMO MK IOEUP F 000000A0 0F (PATTRADF/LNG) MK 1 MYDEMO MK IODRU F 000000B0 3F (PATTRADF/LNG) MK 1 MYDEMO MK INO2 F 000A00301804 (R6) END OF IOPRI MK 2 MYDEMON MK INO2 00 N 001801700609 (R6) MK 2 MYDEMON MK IOIPR N 001801700609 4F 50 004F 0050 MK 2 MYDEMON MK IOIPR N LINE SIZE HAS CHANGED MK 2 MYDEMON MK INO2 N 058000800104 (R6) BEG OF IOPRI MK 2 MYDEMON MK IOEUP N 000000F0 08 (PATTRADF/LNG) MK 2 MYDEMON MK IOEUP N 000000F0 08 (PATTRADF/LNG) MK 2 MYDEMON MK IOEUP N 000000F9 32 (PATTRADF/LNG) MK 2 MYDEMON MK IOEUP N 000000F9 32 (PATTRADF/LNG) MK 2 MYDEMON MK IOEUP N 0000012C 12 (PATTRADF/LNG) MK 2 MYDEMON MK IOEUP N 0000012C 12 (PATTRADF/LNG) MK 2 MYDEMON MK IOPRI N NAT1132 CONDITION DETECTED MK 2 MYDEMON MK IOEUP N 0000013F 32 (PATTRADF/LNG) MK 2 MYDEMON MK IOEUP N 0000013F 32 (PATTRADF/LNG) MK 2 MYDEMON MK IOEUP N 00000172 32 (PATTRADF/LNG) MK 2 MYDEMON MK IOEUP N 0000018F 1E (PATTRADF/LNG) MK 2 MYDEMON MK IOEUP N 0000018F 1E (PATTRADF/LNG) MK 2 MYDEMON MK IODRU N 000001AE 30 (PATTRADF/LNG) MK 2 MYDEMON MK INO2 N 00060180FF08 (R6) END OF IOPRI MK 2 MYDEMON MK INO2 N NAT1132 CONDITION 1 DETECTED |
The column headings of the trace report are explained below:
| GCUID | Current Natural user ID as assigned by the
Natural system variable *USER.
|
| LV | Program level. |
| GPGM | Name of the current program as assigned by the
Natural system variable *PROGRAM.
|
| GCAPL | ID of the current application library as
assigned by the Natural system variable
*APPLIC-ID.
|
| NDATA | Up to 250 bytes of information on Natural nucleus components, to be used by Software AG personnel for debugging. |