The Natural Tools and Utilities in NaturalONE offers a rich GUI interface for the Natural Profiler which evaluates Profiler data in a graphical, interactive browser interface. This section provides a short overview of the tool. For more information, see NaturalONE > Using NaturalONE > Rich GUI Interface of the Natural Profiler documentation.
The Natural Profiler rich GUI reads and analyzes Profiler resource files. How a Profiler resource file is created, is described in the sections Using the Profiler Utility in Online Mode and Using the Profiler Utility in Batch Mode.
 To start the Natural Profiler rich GUI
Start NaturalONE.
In your workspace, select any Natural project, library, or object in the environment in which you want to start the Natural Profiler rich GUI.
Invoke the context menu and choose NaturalONE > Tools and Utilities to start the SYSUTIL utility.
Select Natural Profiler in the tree and click on Execute.
The Natural Profiler rich GUI is started.
The Natural Profiler rich GUI offers the following functions:
List Profiler resources of a given library.
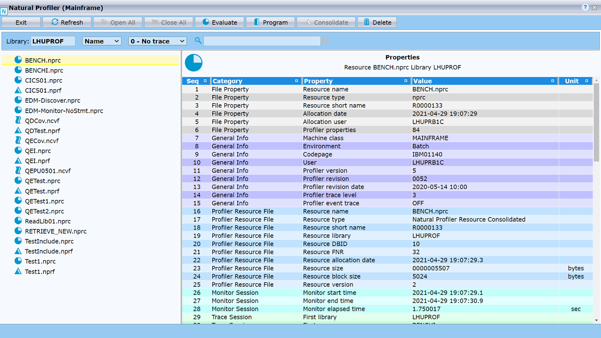
Display the properties and statistics of the profiling for a selected Profiler resource.
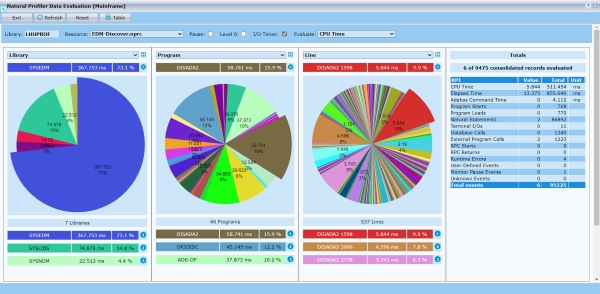
Evaluate the Profiler data in interactive pie charts. They show the distribution of Profiler KPIs for selected criterions like the distribution of the CPU time for programs.
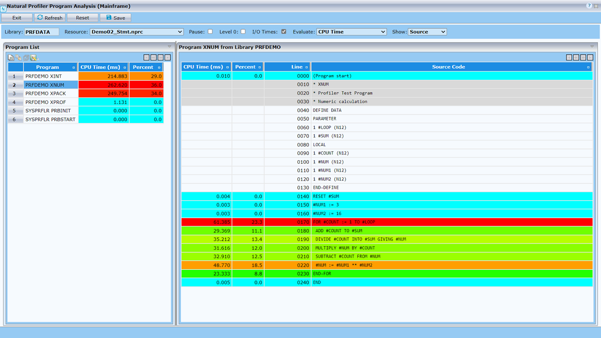
Analyze monitored programs and the source code of a selected program. For a selected KPI (like CPU time), the distribution of the KPI over the programs and over the program lines is displayed.
Consolidate the Profiler data. A selected NPRF resource is read, and the data is consolidated (aggregated). The resulting data is written to an NPRC resource using the same name as the corresponding NPRF resource.
Delete a Profiler resource file.
Help function which provides a detailed description of the current page.
The following pictures show the main pages of the Natural Profiler Rich GUI.
The Natural Profiler page is started initially. It lists the resources of a selected library, and the properties and statistics of a selected resource:
The Natural Profiler Data Evaluation uses interactive pie charts to evaluate the Profiler data:
The Natural Profiler Program Analysis analyses the source of the profiled objects: