This document covers the following topics:
NaturalONE saves the Natural sources in the Eclipse workspace. The compiled objects remain in the Natural environment (local Natural runtime or Natural server). Therefore, debugging is initiated in local mode, that is, from a project which is stored in the Eclipse workspace. This means that the source is available in the workspace and the corresponding generated program is available in the Natural environment. Since there is no virtual machine for Natural in the Eclipse environment, the Natural environment is required for execution. This approach has the advantage that you will be able to test your application in the appropriate environment; that is, in an environment in which your application will be executed in production.
The library in which a generated program is debugged is determined by the mode you have defined for the project (either shared mode or private mode). See Steplibs in Changing the Project Properties for further information.
Important:
Web I/O must be enabled on the Natural server. Otherwise,
the output of a debugged program cannot be displayed.
The standard Eclipse functionality for debugging is used; see the Eclipse online help. The information which is specific to NaturalONE is provided in the topics below.
This information applies only when you are using a Natural server in a Linux or Windows environment.
The debugger needs information from a symbol table in order to
display the names of variables. So that symbol tables can be generated in
Natural, the Natural parameter GPGEN must be set to
"DEBUGGER=ON". This parameter can be set in one of
the following ways:
in the default parameter file NATPARM on the
Natural server (using the Configuration Utility), or
as a session parameter when mapping a Natural server with NaturalONE.
When you catalog or stow an object and
GPGEN is set to
"DEBUGGER=ON", a symbol table is generated as part
of the generated program. This table contains the information relevant to the
variables active for this object.
Variables cannot be accessed when GPGEN is
not set to "DEBUGGER=ON", although it is still
possible to debug the object.
Note:
When you are using a Natural server in a mainframe environment,
a symbol table is always generated as part of the generated program. It is not
required to set a parameter for this purpose.
For details concerning the Default Launch settings, see Launching Natural Applications in section Working with Natural Projects in Local Mode.
Tip:
Since NaturalONE always debugs the generated program in the
Natural environment (and not the source in the local workspace), it is
recommended that you enable the Check time stamp on server
option in the Natural preferences (see
Natural >
Builder in Setting the Preferences).
Thus, you can avoid a situation where the source in your local workspace
differs from the corresponding source on the server, which may lead to
unpredictable results. When a time stamp conflict is found while debugging
(that is, when a source in the local workspace has a time stamp which differs
from the time stamp of the corresponding source on the server), a dialog box
appears, asking whether you want to update the source in the local workspace
with the source from the server. See also
Checking the Time
Stamps in the Natural Environment.
 To start the debugger
Select the program that you want to debug.
Invoke the context menu and choose .
Or:
Press ALT+SHIFT+D, N.
Or:
After the Launch was activated, the Debug perspective is opened. In the Console view, you can see that the connection to the Natural environment is established and that the debugger is started.
In the editor window, the debugger waits at the first executable source code line. You can now use the standard Eclipse functionality to debug the Natural application. If a source cannot be found in the workspace, a dialog box appears asking whether you want to download the object from the Natural environment. If you agree, NaturalONE tries to download the object.
The output of the debugged object is either shown in the internal browser or in an external browser, depending on the settings in the Natural preferences or in the launch configuration that you have created (see below).
Note:
If you receive an error message after
choosing the Debug command which tells you that the
connection to the debug attach server has failed, this indicates that the use
of the debug attach server has been enabled in the Natural preferences (see
Debug Attach
Settings in Setting the Preferences).
For debugging traditional Natural applications, however, a debug attach server
is not required. Therefore, you can disable the debug attach server in the
Natural preferences. Then, the error message will no longer appear and you will
be able to debug your program.
When you are working in the Debug perspective, you can use several commands from the menu, for example:
(automatically uses line breakpoints)
See the Eclipse online help for detailed information on these commands.
NaturalONE uses the following elements in the Debug perspective:
Note:
The Debug perspective can also be opened by choosing
from the
menu.
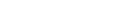
The Debug view displays the stack frame.
In Natural terminology, this is the "call stack" which lists the objects which have been called during the current debugging session in hierarchical order.
Exception: when debugging on a mainframe, only the top-level element is shown in the stack frame.
You can debug several Natural applications or even Java applications in parallel. You determine the application which gets the debugger attention by selecting the appropriate launch configuration in the Debug view.
See the Eclipse online help for further information on this view.
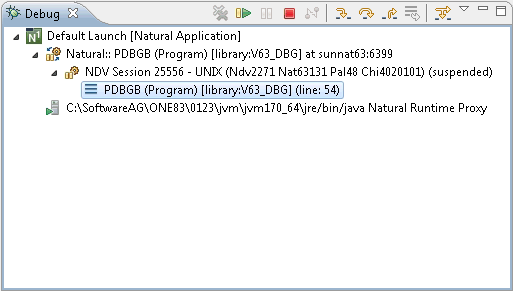
The Variables view shows information about the variables in the currently selected stack frame.
Separate nodes are provided for the different types of variables (global variables, system variables, application-independent variables (AIVs) and context variables). The exceptions are the local variables; they are shown at the top level and are not grouped into a node.
You can change the value of a variable directly in the Value column. You can also do this using the context menu.
Using the command in the context menu, you can add a watch expression for the selected variable which is then added to the Expressions view.
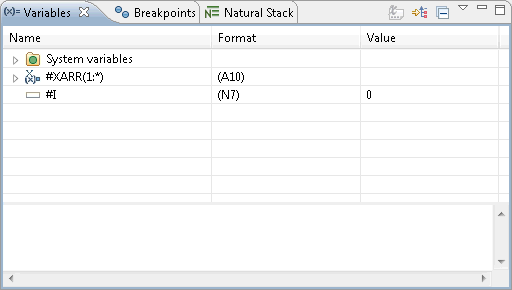
The variable value display within the debugger for large and dynamic variables of type A, U or B in some cases is limited and a Natural developer may not see the value in its complete length.
In order to provide the display of the value in its complete length, you can use the variable value chunks. With this enhancement, variables of type A, U or B are expandable in the Variables and Expressions view if their size is greater than the chunk size.
Value chunks are displayed as children of the variable node. The length of a single chunk is configurable in the Preferences as described under Display Options in Setting the Preferences.
You can handle the variable chunk nodes in the same way as other variable nodes. Its value can be modified and the variable chunk can be added to the Expressions view with the context menu command .
There will be as many variable chunk nodes as are needed to display the whole variable value as displayed in the following screen.
This means that with this enhancement you can watch the complete variable value and modify any part of the value.
See the Eclipse online help for further information on this view.
The Breakpoints view lists all line breakpoints and watchpoints you have set in your workbench projects.
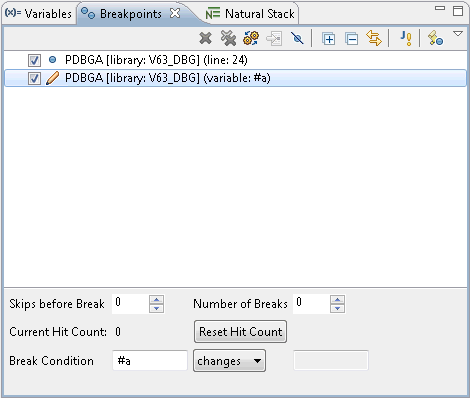
You can use the context menu, for example, to disable a breakpoint or to specify the properties for your breakpoints and watchpoints. You can also specify the properties for your breakpoints and watchpoints using the options at the bottom of the view (for detailed information on these options, see Specifying the Breakpoint and Watchpoint Properties).
See the Eclipse online help for further information on this view.
The Natural Stack view is a Natural-specific view which is shown by default. It shows the current contents of the Natural stack. The top entry in the stack is shown in bold. Modifications between two debugger suspends are marked with a yellow background color.
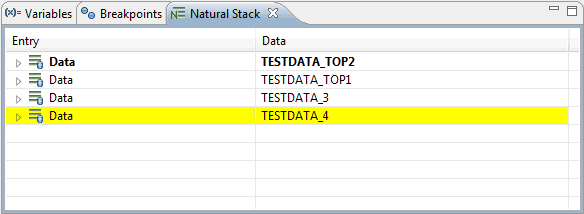
Note:
The Natural Stack view is part of the
Debug perspective. If it is currently not shown, you can redisplay it with
.
The Expressions view is not shown by default. However, is automatically opened when a watch expression is added to this view.
The Expressions view shows the current values for all watch expressions that you have defined. The values change while you step through the code. In Natural terminology, these are the "watchvariables". The benefit of this view is that only the contents of those variables are shown that you want to observe. This is different from the Variables view in which you see all used variables and the Natural system variables at the same time.
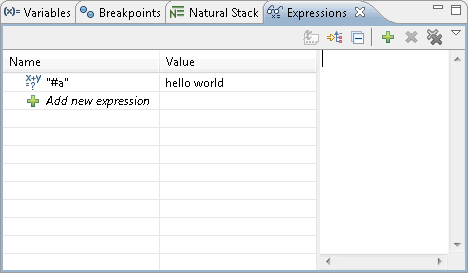
You can use the context menu, for example, to remove one or more watch expressions.
For watch expressions which can be expanded, it is possible to edit the values of the contained variables. For example, when you expand an array, you can change the values of the occurrences.
See the Eclipse online help for further information on this view.
The current trace position is indicated by an arrow in the marker bar of the editor window. When the debugger is started, the trace position is shown at the first executable source code line.
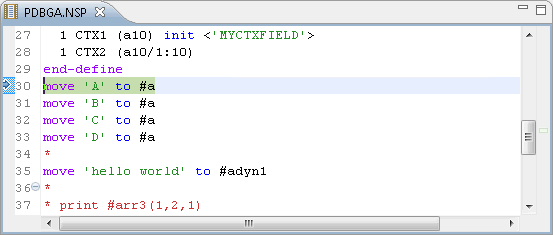
You can use Eclipse features such as breakpoints, stepping, or expression evaluation to debug your program. See the Eclipse online help for further information.
To add a breakpoint, you can simply double-click on the marker bar, directly next to the line for which you want to add the breakpoint. To remove this breakpoint, you simply double-click it once more in the marker bar.
When you add breakpoints while the Natural runtime on the server is suspended, the new breakpoints are considered when the Natural runtime is resumed.
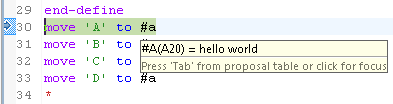
When the debugger is in suspend mode, it is possible to display the current format/length and value of a Natural variable by positioning the mouse over the variable (in Eclipse terminology, you "hover" over the variable name in the editor). The current content is then shown in a hover, for example:
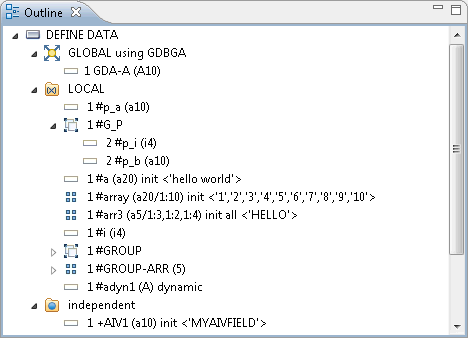
The Outline view provides the same information for a source as in the NaturalONE perspective. It visualizes the hierarchical structure of the program.
You can modify a breakpoint or watchpoint by changing its properties.
Every breakpoint or watchpoint has a hit count which increases every time the debug entry is passed. With NaturalONE, the number of executions of a debug entry can be restricted in the following ways:
A number of skips can be specified before the breakpoint or watchpoint is executed. The debug entry is then ignored until the event count is higher than the number of skips specified.
A maximum number of executions can be specified, so that the breakpoint or watchpoint is ignored as soon as the event count exceeds the specified number of executions.
To modify a breakpoint or watchpoint
In the Breakpoints view, select the breakpoint or watchpoint.
Invoke the context menu and choose Breakpoint Properties.
Or:
Press CTRL+ENTER.
The Eclipse dialog boxes which appear for the properties of the breakpoints and watchpoints have been adapted to Natural. The content of the resulting dialog box depends on the selected item.
Modify the breakpoint or watchpoint as described in the topics below.
Choose the button.
The following topics are covered below:
The following dialog box appears for a breakpoint.
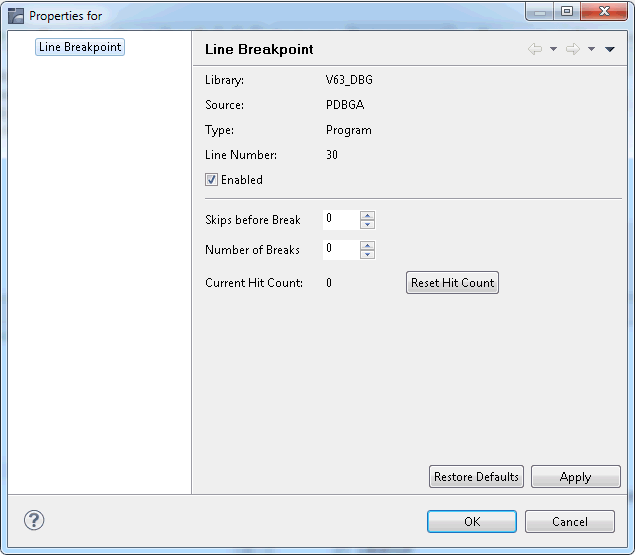
You can set the following Natural-specific options:
- Skips before break
The number of skips before execution of the breakpoint if it is not to be executed until the program has run a certain number of times. The default is 0.
- Number of breaks
The maximum number of executions of the breakpoint. After this number has been reached, the breakpoint is ignored. The default is 0.
- Reset Hit Count
When you choose this command button, the current hit count is reset to 0.
The following dialog box appears for a watchpoint.
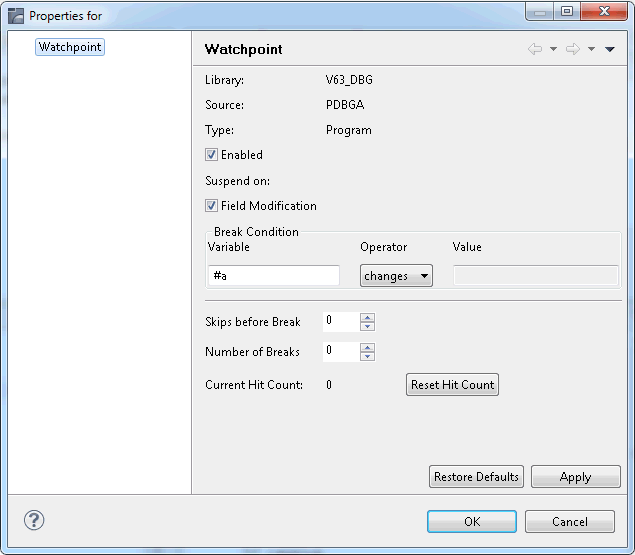
You can set the following Natural-specific options:
- Variable
The variable that is to be watched in the debugged program.
- Operator/Value
To define a condition for the watchpoint, select an appropriate watchpoint operator and specify a value for this operator. If you do not specify a condition, the default setting (changes) applies.
The watchpoint operators are:
Operator Activation of the Watchpoint changes Each time the variable is changed. Default. EQ (=) Only when the current value of the variable is equal to the specified value. NE (!=) Only when the current value of the variable is not equal to the specified value. GT (>) Only when the current value of the variable is greater than the specified value. LT (<) Only when the current value of the variable is less than the specified value. GE (>=) Only when the current value of the variable is greater than or equal to the specified value. LE (<=) Only when the current value of the variable is less than or equal to the specified value. - Skips before break
The number of skips before execution of the watchpoint if it is not to be executed until the program has run a certain number of times. The default is 0.
- Number of breaks
The maximum number of executions of the watchpoint. After this number has been reached, the watchpoint is ignored. The default is 0.
- Reset Hit Count
When you choose this command button, the current hit count is reset to 0.
This information applies only when you are debugging a program which is associated with a Linux or Windows environment.
You can instruct the debugger to skip code and to resume execution of the object with the source code line in which you have placed the cursor. The skipped code is not executed.
| Warning: Depending on the code you want to skip, the command may lead to unpredictable results. Use this command with care. |
To go to the next statement
In the editor area of the Debug
perspective, place the cursor in the source code line with which you want to
resume execution. This line can be located before or after the current trace
position. It must contain an executable statement such as MOVE or
PRINT (it must not contain a non-executable statement such as
DEFINE DATA or a comment).
Invoke the context menu and choose .
The new trace position is now indicated by the arrow in the marker bar of the editor window. When you resume debugging, the debugger continues the execution of the object with this source code line.
Notes: