
This document covers the following topics:
A very common and regularly asked question in any company or organization is, whether and how an existing application can be tuned to further increase its performance. Giving an appropriate answer could be difficult, because any kind of business logic can be quite complex. During execution, a lot of objects are passed and it is hard to decide what the control flow looks like.
Performance optimization or an analysis of such logic usually requires a deep understanding of the application, and also detailed information about the amount of time spent in the various parts of the application. Modifying the code manually to measure the time means a lot of effort and is usually discarded. But how can you retrieve this information?
Software AG provides a tool, the Natural Profiler to fill this gap. The Natural Profiler can provide you with a very fast overview about the time-consuming parts of a Natural application. No code modification is required, and moreover, just a basic knowledge of the application is sufficient. The Natural Profiler collects the required information from the Natural execution environment on Linux, Windows or mainframe platforms and presents it in a clear and simple manner.
How a performance analysis could be achieved is described in the following sections.
During a Natural session, different kinds of events may occur (for example "starting a program", "before a database call", etc.). The Natural Profiler - using an integrated routine in the Natural environment - intercepts the event and collects data specific to the event in a trace record. When a Natural application is profiled under NaturalONE, the event data is immediately interpreted by NaturalONE and visualized. When a Natural application is profiled outside NaturalONE (for example in Natural Batch), the event data is written to a Natural resource file which can be read and visualized in NaturalONE at any time later. See Displaying Natural Profiler Resource Data in the Using NaturalONE documentation for more information.
The resulting performance data is presented on the Hot Spots page. It shows how the CPU and elapsed time is distributed over the programs, statements and even program lines of the application, and how often a statement was executed. In the Event Trace page all events which have occurred during the Natural session, are listed.
The most important questions when tuning an application are: where are the most time-critical parts in my business logic? And, how do I get the information?
First of all, start profiling while you execute the application as usual. Within NaturalONE, you will see where the hotspots (the time-consuming parts of your application) are. Use this information to take the next iteration steps. Take a closer look into the time-consuming parts of the logic using the statement trace. If the collected information is still not sufficient, start logging the event trace. This is, of course, just an example - the steps may vary depending on the complexity of the investigated business logic.
The easiest way to start profiling is offered by NaturalONE for programs available in the local mode. Use the context menu function which executes the program as usual and simultaneously starts the profiling. This is described in Starting a Profiler Session in the Using NaturalONE documentation.
How you start profiling outside NaturalONE depends on the platform on which the application is running:
On Linux and Windows, profiling is started by specifying the
PROFILER parameter in the parameter file or as a dynamic
parameter. The PROFILER parameter is described in detail
in the Parameter Reference section of the Natural
documentation corresponding to your platform.
On mainframes, profiling of batch applications is started by
invoking the INIT and the START function of the
Profiler utility in batch mode. For details, see the section Profiler
Utility - Batch Mode in the Utilities section of
the Natural for Mainframes documentation.
Mainframe online applications can be profiled with the Profiler utility in online mode. The Profiler utility offers functions to view the event data online. The data can be saved as resource file and interpreted by NaturalONE. For details, see the section Profiler Utility - Online Mode in the Utilities section of the Natural for Mainframes documentation.
When an application is profiled in NaturalONE or when a Profiler resource is opened, the Profiler displays the output on two general pages:
Hot Spots
Event Trace
The Event Trace page shows all events which have occurred during the monitored Natural session. This page is only displayed if the event trace option has been selected in the Natural preferences or if an nprf resource file is opened.
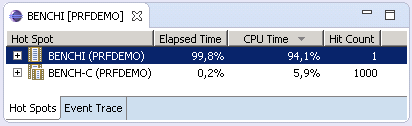
For a performance analysis, the Hot Spots page is of most interest. It shows the distribution of the elapsed time and CPU time of the objects executed. The elapsed time is the overall time elapsed in the real world while executing the profiled application. The CPU time is the time the processor requires to execute the application. In general, the CPU time is the better performance indicator because the elapsed time depends on varying factors such as on the machine load, I/O wait times, database calls, execution times, etc.
If you sort the Hot Spots page by the CPU time (click on the CPU Time entry in the header line), the objects which required the most CPU time are listed first. These are the objects which should be analyzed further for performance optimization.
In the example below, the program BENCHI consumed the most CPU time:
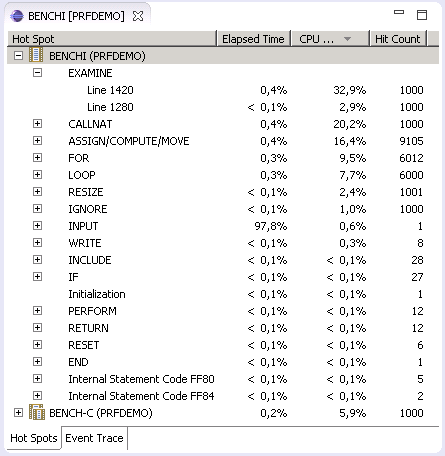
The Natural Profiler enables you to look closer into the profiled objects. If you expand the node of an object, it shows how the time consumed by the object is distributed over the statement types. If you further expand the node of a statement type, the Natural Profiler shows the elapsed and CPU time of individual lines in the source.
Notes:
SYMGEN=ON was set (for Windows and Linux objects). If the event
data is read from a resource file, it is additionally required that statement
events have been collected.
NS event type has been selected in the
EVENT subparameter of the PROFILER
parameter. See the Parameter Reference section of the
Natural documentation corresponding to your platform.
STATEMENT=ON or STATEMENT=COUNT has been selected
for the event filter. See the section Event Filter under
Profiler Utility - Batch Mode in the
Utilities section of the Natural for
Mainframes documentation.
In the above example, when expanding the node of the program BENCHI
you can see that the most CPU time (35.8%) was required by the
EXAMINE statements. If you further expand the
EXAMINE node, you can finally find that line 1420 had the
highest CPU time consumption:
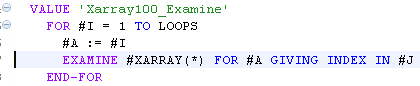
If the application was profiled with NaturalONE, you can
double-click on a line entry. NaturalONE will then open the corresponding
source and navigate directly to the selected line. In the example, if you
double-click on line 1420, NaturalONE opens the program BENCHI and positions to
the line with the time-consuming EXAMINE
statement:
Notes:
Profiling a long-running application can produce huge amounts of data, especially when Natural statements are monitored. The more data the Profiler generates, the more time is required to transport the data from the server to the NaturalONE client. This section describes how to minimize the amount of data while still monitoring what matters. The following strategies are covered:
When a Natural application is profiled, the Natural nucleus collects one record for each event. These are the records displayed in the Event Trace page. The Hot Spots page shows the data in a consolidated (aggregated) format. NaturalONE summarizes the event data so that, for example, instead of 1000 entries of the same line, only one hot-spot entry is displayed. This consolidated entry shows a hit count of 1000 and reflects the total elapsed and CPU time consumed by all 1000 traced events combined.
If no event trace is required, the data can already be consolidated on the server side which heavily increases the flow-rate.
For a server-side data consolidation of a Linux or Windows application profiled under NaturalONE, unselect the Enable event trace option in the Natural Event Trace preferences as described in Event Trace under Profiler in the section Setting the Preferences.
For a server-side data consolidation of a Linux or Windows
application profiled outside NaturalONE, switch off the EVENTTRACE
subparameter of the PROFILER parameter. See the
Parameter Reference section of the Natural documentation
corresponding to your platform.
There is no server-side data consolidation of mainframe applications profiled under NaturalONE.
For a server-side data consolidation of a mainframe
application profiled outside NaturalONE, switch on the CONSOLIDATE
keyword of the Profiler utility INIT function. See
Initializing Profiling in the Natural
Profiler section of the Utilities documentation,
which is part of the Natural for Mainframes
documentation.
If you have profiled an application outside NaturalONE without
the server-side data consolidation, you can consolidated the data later with
the Profiler utility CONSOLIDATE function which is available on
all platforms.
Natural Profiler sampling is a statistical approach that significantly reduces the number of events. For every sampling CPU-time interval, the Natural Profiler collects only one event (the last one) and discards all others. The sampling provides a good estimation of the consumed CPU time. It does not give other estimations such as hit counts, elapsed times, Adabas times, etc.
For applications profiled under NaturalONE, select the Enable sampling option in the Natural Hot Spots preferences as described in Hot Spots under Profiler in the section Setting the Preferences.
For Linux or Windows applications profiled outside NaturalONE,
switch on the SAMPLING subparameter of the
PROFILER parameter. See the Parameter
Reference section of the Natural documentation corresponding to your
platform.
For mainframe batch applications, specify
SAMPLING=ON for INIT function of the Profiler
utility. For detailed information about sampling see the section
Sampling under Profiler Utility - Batch
Mode in the Utilities section of the
Natural for Mainframes documentation.
Statement events have the biggest impact on the performance and quantity of the Profiler data. In comparison to statement events, all other events have only a low impact on the performance but they can also enlarge the quantity. It is, therefore, recommended to monitor statement events only if you really need them. Of the other events, you should only monitor those which you want to analyze.
For applications profiled under NaturalONE, unselect the Profile statements option in the Natural Hot Spots preferences and the Natural Statement option in the Natural Event Trace preferences as described in Hot Spots and Event Trace under Profiler in the section Setting the Preferences.
For Linux or Windows applications profiled outside NaturalONE,
unselect the NS event type in the EVENT subparameter
of the PROFILER parameter. See the Parameter
Reference section of the Natural documentation corresponding to your
platform.
For mainframe batch applications, specify
STATEMENT=OFF for the event filter. See the section Event
Filter under Profiler Utility - Batch Mode in the
Utilities section of the Natural for
Mainframes documentation.
In general, you can pause and restart the Profiler data collection
from the profiled Natural application by calling the application programming
interface (API) USR8210N. See the
Application
Programming Interface section in the Using
NaturalONE documentation.
For applications profiled outside NaturalONE, you can use the Natural programs delivered in the SYSPRFLR library to pause and restart the data collection. See Using Profiler Delivered Programs in Starting and Pausing Data Collection under Profiler Utility - Batch Mode in the Utilities section of the Natural for Mainframes documentation. The programs in the SYSPRFLR library are available on all platforms.
For monitoring long-running applications, it can be helpful to combine some of the above strategies. You should keep in mind that the consolidation works best for program loops, whereas sampling works in any situation but should only be used for CPU analysis.
In a first approach statements are not monitored. The server-side consolidation is used if available. On the Hot Spots page you can see which program has consumed the most time and the program hit counts are also valid.
In a second profiler run, you can monitor the statements and use the start and pause functions to collect only data of those objects with the highest CPU times. Use sampling and if available, the server-side consolidation. On the Hot Spots page you can see the program lines with the highest CPU times.