
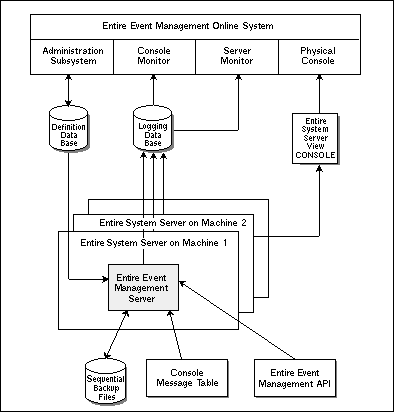
The Entire Event Management system consists of components of the following types:
These component types are described below. In this documentation, component types are written with initial capital letters.
A Physical Console is the normal console of an operating system and displays all messages from that operating system. It is also identified by the Entire System Server Node number of the operating system. The user can switch to each Physical Console and view all the messages from each supported operating system in a network.
For a Physical Console to function, Entire System Server must be installed in the appropriate operating system and an Entire System Server Node object must be defined within Entire Event Management.
A Server searches its Physical Console for messages that are inside the Included Message Ranges, but outside the Suppressed Message Ranges that are specified in a Logical Console definition. It then routes these messages to the Logging Database for display in that Logical Console.
The Server also checks for Events as defined by Automation Rules. When an Event occurs, the Server executes the appropriate Actions.
A Server must be defined in the Entire Event Management environment and must be started under Entire System Server in the corresponding operating system for each operating system to be controlled by Entire Event Management.
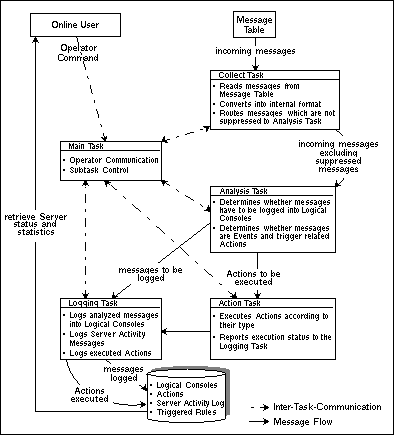
The Server consists of several service tasks running as subtasks under Entire System Server:
The Main Task attaches the other subtasks and controls them via inter-task communication. When an online user issues a Server control command such as SHUTDOWN SERVER or REFRESH statistics, the Main Task processes the command by telling the subtasks to terminate or report their statistics. The Server statistics are written to the (Act) Console in the Logging Database, from which they can be retrieved by the online user.
The Collect Task reads all incoming messages from the Console Message Table and converts them into internal format. It checks the messages against a list of IDs of suppressed messages, which is maintained as a Server parameter. Finally, it routes messages that are not suppressed to the Analysis Task.
The Analysis Task checks the messages against the conditions defined in the Message Ranges. In this way, it selects messages which must be logged to a Logical Console and determines whether the messages are Events and trigger Actions. It routes messages to be logged to the Logging Task and Actions to be executed to the Action Task.
The Logging Task logs analyzed messages to their corresponding Logical Consoles; logs messages related to Automation to the (Aut) Automation Console; optionally logs messages which are not yet covered by the currently defined Logical Consoles to the (Udf) Undefined Console; logs Server Activity messages to the (Act) Activity Console for each Server start, restart or renew and logs Server protocol messages to the (Log) Console. All these Logical Consoles are located in the Logging Database.
The Action Task executes Actions according to their type. It routes the result of the executed Actions to the Logging Task which logs this result to the (Aut) Automation Console in the Logging Database.
The following figure illustrates the flow of information through a Server:
The Server Monitor is a reporting facility that provides information on the activities of a Server. This includes a Statistic Monitor, which shows the status of Server tasks and the information flow between the various service tasks as well as an Activity Monitor which shows which Logical Consoles are currently being served by the Server and which are the most recent messages routed to these Consoles.
The Console Monitor lists all Logical Consoles defined in the User's Profile and shows the most recent messages routed to these consoles. You can access the Logical Console and display its messages by invoking line commands. The user can scroll up and down through the messages, scan for strings and enter selection criteria for most fields.
The Logging Database stores all messages which are routed by any Server to a Logical Console, all Events and executed Actions in the (Aut) Automation Console, all Server Activity messages in the (Act) Activity Console and all Server protocol messages in the (Log) Console (see the section Server).
How long a message remains in the Logging Database depends on the specifications made in the Logical Console. The system provides a batch utility which can be started every day. It deletes all messages from the Logical Console, for which the time limit has been exceeded. For more information, see Maintaining the Logging Database in the Installation and Customization on Mainframes documentation.
The Administration Subsystem maintains all Entire Event Management objects, for example, all definitions necessary to build Logical Consoles and to respond to certain messages automatically. Authorization definitions are also maintained here. For a detailed explanation of the objects maintained, see the section Entire Event Management Object Types.
The Definition Database holds all object definitions: User IDs, Profiles, Calendars, Entire System Server Node numbers, Server Parameters, Message Ranges, Logical Consoles, Logical Console Layouts, Automation Rules, Events and Actions.
The Entire Event Management API enables applications to forward exception messages, so-called events, to the Entire Event Management server for further analysis. The server determines by means of filter and automation rule definitions provided by the administrator whether the event must be logged in the database and which automated actions must be executed.