The Natural Profiler is used to monitor the internal process flow of a Natural batch application and to analyze the performance and the code coverage of the application.
The Profiler utility is controlled by JCL input and provides functions for data collection and data processing:
The data collection functions control Profiler tracing, select required event types, filter, consolidate (aggregate) or sample data and write the resulting events to the Profiler resource file.
The data processing functions read and process the event data from the Profiler resource file. Unconsolidated event data can be consolidated.
You can output statistics, a program summary, a program trace, an event trace with the most important data, and reports on program and statement coverage. You can export the resulting data in text or CSV (comma-separated values) format.
The Profiler resource file can be read by NaturalONE which displays the full event trace and provides a performance analysis (hot spots) of the Natural batch application. Coverage data can be inspected in the NaturalONE Coverage view and in the NaturalONE source editor. The exported profiling event data can be analyzed with the Natural Profiler MashApp which visualizes the data on an interactive MashZone dashboard.
This section covers the following topics:
This section briefly describes the steps required for profiling Natural batch applications and viewing the results. The instructions provided here may serve as a guideline when starting to use the Natural Profiler. Detailed information regarding the steps is provided in the remainder of this chapter.
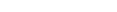
The steps to take depend on the evaluation you want to perform for your application as illustrated in the following graphic:
Check that the prerequisites are met.
Add the Profiler utility INIT and START
functions to the Natural batch job to start the event data collection. Example
for z/OS:
//CMSYNIN  DD  *
PROFILER
FUNCTION=INIT                /* Initialize profiling
  RESOURCE=ON                /* Write to resource
  RESOURCE-NAME='ResNam',REPLACE=YES  /* Resource name
  RESOURCE-LIB=RESLIB        /* Resource library
FUNCTION=START               /* Start data collection
END-PROFILER                 /* End Profiler input
LOGON PRFDEMO
XPROF
10000
FIN
In the example above, the Profiler event data is written to a resource
file with the name ResNam.nprf in the library RESLIB.
See also Initializing
Profiling and
Starting and Pausing
Data Collection.
Open the NPRF resource in NaturalONE to view the hot spots and the event trace.
Submit a Natural batch job with the Profiler utility READ
function to print an event trace, a program trace and the Profiler statistics.
Example:
FUNCTION=READ           /* Read Profiler data
  RESOURCE-LIB=RESLIB   /* Resource library
  RESOURCE-TYPE=NPRF    /* Use resource type NPRF
  EVENT=ON              /* Print event trace
  PROGRAM=ON            /* Print program trace
  STATISTICS=ON         /* Print statistics
See also Profiler Utility READ Function.
Submit a Natural batch job with the Profiler utility
CONSOLIDATE function to consolidate (aggregate) the event data.
Example:
FUNCTION=CONSOLIDATE    /* Consolidate Profiler data
  RESOURCE-LIB=RESLIB   /* Resource library
  REPLACE=YES           /* Replace resource
The consolidated Profiler event data is written to the resource
ResNam.nprc in the library RESLIB. See
Consolidating Event
Data.
Open the NPRC resource in NaturalONE to view the hot spots.
Submit a Natural batch job with the Profiler utility READ
function to generate a program summary and the Profiler statistics.
Example:
FUNCTION=READ           /* Read Profiler Data
  RESOURCE-LIB=RESLIB   /* Resource library
  RESOURCE-TYPE=NPRC    /* Use resource type NPRC
  PROGRAM=ON            /* Print program summary
  STATISTICS=ON         /* Print statistics
See also Profiler Utility READ Function.
Submit a Natural batch job with the Profiler utility
MASHZONE function to write the data to Work File 7 in the format
expected by the Natural Profiler MashApp. Example:
FUNCTION=MASHZONE       /* Write MashZone format to Work File 7
  RESOURCE-LIB=RESLIB   /* Resource library
See also Exporting Event Data for MashZone.
Export the data of Work File 7 with any tool (such as FTP) as a CSV (comma-separated values) file to the Natural Profiler data directory in the MashZone environment.
Enter a reference to the new file in the Overview.csv
file in the resources\Profiler directory.
Open the Natural Profiler MashApp and select the corresponding input file to evaluate the event data.
Notes:
READ, CONSOLIDATE or MASHZONE function
of the Profiler utility, the last created NPRF or NPRC resource in the library
is used.
This section briefly describes the steps required for performing the code coverage of a Natural batch applications and viewing the results. The instructions provided here may serve as a guideline when starting to use Natural code coverage. Detailed information regarding the steps is provided in the remainder of this chapter.
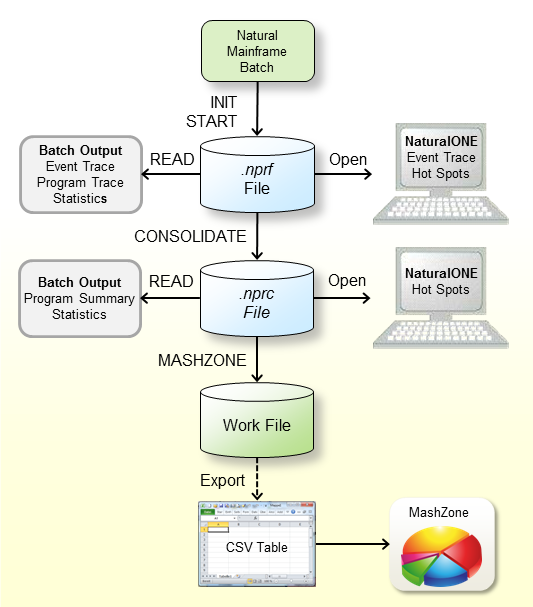
The steps to take depend on the evaluation you want to perform for your application as illustrated in the following graphic:

Check that the prerequisites are met.
Add the Profiler utility COVERAGE and START
functions to the Natural batch job to start the code coverage data collection.
Example for z/OS:
//CMSYNIN  DD  *
PROFILER
FUNCTION=COVERAGE            /* Initialize coverage
  RESOURCE=ON                /* Write to resource
  RESOURCE-NAME='ResNam'     /* Resource name
  REPLACE=YES                /* Replace the resource
  RESOURCE-LIB=RESLIB        /* Resource library
FUNCTION=START               /* Start data collection
END-PROFILER                 /* End Profiler input
LOGON COVDEMO
TESTCOVP
FIN
In the example above, the Profiler coverage data is written to a
resource file with the name ResNam.ncvf in the library
RESLIB. See also Initializing Code
Coverage and
Starting and Pausing
Data Collection.
Open the NCVF resource in NaturalONE to obtain the Code Coverage view.
From the NaturalONE Code Coverage view, you can directly edit the source. The editor shows all lines containing covered statements with a green background.
Submit a Natural batch job with the Profiler utility
READ function
to print the program and statement coverage and the Profiler statistics.
Example:
FUNCTION=READ           /* Read Profiler data
  RESOURCE-LIB=RESLIB   /* Resource library
  RESOURCE-TYPE=NCVF    /* Use resource type
  EVENT=ON              /* Print statement co
  PROGRAM=ON            /* Print program cove
  STATISTICS=ON         /* Print statistics
  EXPORT=ON             /* write to work 7
  FORMAT=C              /* Semicolon/Comma/Text
If the EXPORT keyword of the Profiler utility
READ function is switched on, the output is written to Work File
7. If FORMAT is specified as C or S, the
result is written as comma-separated values (CSV) where a comma or a semicolon
is used as a separator, respectively.
Export the data of Work File 7 with any tool (such as FTP) as a CSV-formatted file to a Windows environment if you want to process it further in Microsoft Excel.
Notes:
READ function of the Profiler utility, the NCVF resource created
last in the library is used.
The following prerequisites must be met before you can use the Profiler utility in batch mode:
For the Natural Profiler data collection functions (INIT,
COVERAGE, START, PAUSE and
TEXT), you must set the following Natural profile parameters.
RDCSIZE - Activate
the Natural Data Collector (without recording data in the buffer of the Natural
Data Collector):
RDCSIZE=2
RDCEXIT - Define
NATRDC1 as a user exit for the Natural Data Collector:
RDCEXIT=NATRDC1
PDPSIZE - Optional
parameter you can set additionally to determine the size of the Profiler data
pool, for example:
PDPSIZE=1000
The Profiler utility data processing functions
(CONSOLIDATE, READ, MASHZONE,
LIST and DELETE) cannot be executed if profiling is
active. For performance reasons, we recommend that you also deactivate the
Natural Data Collector for these functions with the following (default)
parameter setting:
RDCSIZE=0
For details regarding the Natural profile parameters mentioned above, see the relevant sections in the Parameter Reference documentation.
The Natural nucleus must be reentrant and reusable. Use the following linkage options:
RENT,REUS
By default, Natural mainframe resource files are not displayed in Natural Development Server (NDV) environments such as NaturalONE or Natural Studio. For analyzing the Profiler event data, the resource file must be accessed from NaturalONE. Therefore, you have to modify the NDV behavior.
![]() To display resource files in an NDV environment
To display resource files in an NDV environment
Copy the source code of the NDV user exit NDV-SX03 from
the Natural system library SYSLIB into a user library.
Edit the member. Adjust the code as described below:
DISPLAY-RESOURCES := 'Y' /* Display resources in NaturalONE/Studio
Catalog it under the name NDV-UX03.
Copy it back into the system library SYSLIB or into the
library SYSLIBS or SYSTEM.
If NaturalONE is installed at your site, you can activate the
Profiler utility data processing functions (CONSOLIDATE,
READ, MASHZONE, LIST and
DELETE) with the following steps:
Start NaturalONE.
In the Natural Server view, map to the environment where the Profiler resources reside.
Add the program ACTIVATE contained in the system
library SYSPRFLR to a new or existing project in NaturalONE.
Profile the program ACTIVATE with the context menu
function Profile As > Natural
Application.
Verify that the user-defined event data on the Event Trace page of the NaturalONE Profiler contains the activation success message.
When the program ACTIVATE is profiled, a NaturalONE
Profiler key is generated and written to the Natural resource
NaturalONEProfilerKey.nprk in the system library
SYSPRFLR. Each Profiler data processing function reads this
resource and checks the key. If the key is valid, the function is performed. A
newly generated key is valid for one year. It can always be regenerated.
The Profiler data processing function starts issuing a warning 9 days before the key expires, and returns an error message if no key is found or if the key is not valid.
This section provides instructions for invoking and terminating the Profiler utility in batch mode.
![]() To invoke the Profiler utility
To invoke the Profiler utility
Enter the following system command into the primary command input
data set CMSYNIN:
PROFILER
Note:
After the PROFILER system command, the Profiler
expects one or more lines with Profiler keyword entries.
![]() To terminate the Profiler utility
To terminate the Profiler utility
Enter the following Profiler keyword into the primary command input
data set CMSYNIN:
END-PROFILER
Or:
END
Or:
.
The Profiler utility in batch mode reads the Profiler keywords that
control the profiling from the primary command input data set
CMSYNIN. The Profiler reads the input lines until it reaches the
END-PROFILER keyword (or END or .).
This section covers the following topics:
The symbols used in the syntax diagrams shown in this section are explained in System Command Syntax in the System Commands documentation.
You enter a Profiler utility command using either of the following syntax formats:
| keyword[=value][,keyword[=value]]... |
Or:
| keyword |
| [value] |
| ... |
Notes:
IM=D).
STACK profile parameter or if
the data is entered in forms mode (IM=F).
The following rules apply:
Empty lines and lines starting with an asterisk (*) are
ignored.
All characters in a line from /* to */ or
to the end of the line are ignored.
Some keywords have no associated value.
Blanks can be added before or after the keyword or value.
Multiple keywords in a line are separated by commas (applies to the first syntax format only).
A value can be enclosed in apostrophes
('value').
A value must not contain a comma.
Keywords and values can be specified in upper or lower case.
The maximum input line length is 78 characters.
The Profiler utility can be executed multiple times in one Natural
session. For example, it is first executed with the INIT and START functions, and then, after the
execution of a user program, it is executed with the PAUSE
function.
The following Natural batch example (on z/OS) shows the original JCL
which runs the XPROF program on the PRFDEMO library
(lines in normal font) and the Profiler utility input lines which are used to
profile the XPROF program (lines in bold).
//CMSYNIN  DD  *
PROFILER
FUNCTION=INIT                /* Initialize profiling
  RESOURCE=ON                /* Write to resource
  RESOURCE-NAME='Demo01',REPLACE=YES  /* Resource name
  RESOURCE-LIB=PRFDATA       /* Resource library
FUNCTION=START               /* Start data collection
END-PROFILER                 /* End Profiler input
LOGON PRFDEMO
XPROF
10000
FIN
The following Natural batch example (on z/OS) demonstrates how the
Profiler is to be executed with the Natural STACK profile parameter.
STACK=(
 PROFILER FUNCTION:INIT:
   RESOURCE:ON:
   RESOURCE-LIB:PRFDATA:
   REPLACE:YES:
 FUNCTION:START:
 END-PROFILER;
 LOGON PRFDEMO
 )
The main keywords used in the syntax of the Profiler utility in batch mode are described in the following table. Any additional (subordinate) keywords available for a main keyword are described in the sections referenced in the table. In general, a subordinate keyword value must follow the main keyword value, for example:
FUNCTION=READ
  PRINT=ON
A subordinate keyword specified before the first FUNCTION
or FILTER keyword is treated as a subordinate keyword of the first
FUNCTION or FILTER keyword.
The following main keywords are available:
| Keyword | Value | Description |
|---|---|---|
FUNCTION |
Perform a Profiler utility function. | |
CONSOLIDATE |
Consolidate (aggregate) resource data. See Consolidating Event Data. | |
COVERAGE |
Initialize Natural code coverage. This function is mandatory for the code coverage data collection. See Initializing Code Coverage. | |
DELETE |
Delete a Natural Profiler resource file. See Maintaining Profiler Resource Files. | |
INIT |
Initialize profiling. This function is mandatory for the profiling data collection. See Initializing Profiling. | |
LIST |
List Profiler resources. See Listing Profiler Resource Files in Maintaining Profiler Resource Files. | |
MASHZONE |
Export resource data in MashZone format. See Exporting Event Data for MashZone. | |
PAUSE |
Pause the data collection. See Starting and Pausing Data Collection. | |
READ |
Read and evaluate resource data. See Evaluating Event Data. | |
START |
Start or restart the data collection. See Starting and Pausing Data Collection. | |
TEXT |
Add a user event to the event data. See Writing User-Defined Events. | |
FILTER |
Define Profiler filters to reduce the amount of event data. See Using Filters to Limit the Data Collected. | |
COUNT |
Set the event count filter. | |
EVENT |
Set the event, FNAT and statement filters. | |
PROGRAM |
Set the library, program and line filters. | |
TIME |
Set the CPU time filter. | |
RPC |
Profile a batch Natural RPC server. See Profiling a Batch Natural RPC Server. | |
ON-ERROR |
Determine how Profiler error situations are
handled.
Default: |
|
CONTINUE |
The profiling is stopped but the Natural session continues. | |
TERMINATE |
The Natural Profiler forces a termination of the Natural session. | |
TRACE |
0 - 10 |
Set the level of internal trace of the Profiler
trace session. The internal trace contains information such as Profiler errors
and is written to the standard output of the trace session
(CMPRINT data set). See
Internal
Trace.
Default: |
HELP |
A summarized description of the Profiler keywords is written to standard output. | |
INCLUDE |
object-name |
The name of the Natural text object that
contains Profiler input data.
See also Including Profiler Input from Natural Text Objects. |
INCLUDE-LIB |
library-name |
The name of the Natural library that contains
the text object specified with the INCLUDE keyword.
If the Natural system variable
The library name is used for all following Default: If See also Including Profiler Input from Natural Text Objects. |
END-PROFILER
or
or
|
End of Profiler input. The keyword
END-PROFILER, END or a period (.)
indicates the end of the Profiler input.
|
|
ONLINE |
Perform the online Profiler utility in a batch
run. This option is for compatibility with earlier Natural versions, when the
Profiler utility in batch mode started the Profiler online menu. If this
functionality is still required, use ONLINE as the first keyword.
All subsequent input is handled by the Profiler online menus.
|
This section describes the events and data processed by the Profiler utility in batch mode.
During a Natural session, different types of events can occur (for example, a program start) where the Profiler collects data specific to the event in a trace record. Each event is associated with an event type, that is, a one or two letter code. Related event types are combined into an event group which is denoted by a one letter code.
The following events, event types and event groups are available:
| Event | Event Type | Event Group | When the Event Occurs |
|---|---|---|---|
| Session Initialization | SI |
S |
When a Natural batch session is initialized. Because the Profiler monitor session starts after the trace session, this event cannot be monitored. |
| Session Termination | ST |
S |
When a Natural batch session is terminated. The Profiler always monitors this event. |
| Program Load | PL |
P |
When a program (Natural object) is loaded or when it is already located in the buffer pool. |
| Program Start | PS |
P |
When a program (Natural object) is started. |
| Program Termination | PT |
P |
When a program (Natural object) is terminated. |
| Program Resume | PR |
P |
When a program (Natural object) resumes control
after another Natural object has been executed or when control returns to level
0 (no program active).
|
| Program Information | PI |
P |
When a program (Natural object) is accessed for the first time. This event is only triggered at Natural code coverage. |
| Before Database Call | DB |
D |
Before a database call is executed. |
| After Database Call | DA |
D |
After a database call has been executed. |
| Before Terminal I/O | IB |
I |
Before a terminal input/output is executed. |
| After Terminal I/O | IA |
I |
After a terminal input/output has been executed. |
| Before External Program Call | CB |
C |
Before an external program call
(CALL statement) is executed.
|
| After External Program Call | CA |
C |
After an external program call
(CALL statement) has been executed.
|
| Runtime Error | E |
E |
When a Natural runtime error has occurred. |
| Natural Statement | NS |
N |
When a Natural statement is executed. For
technical reasons, there is no one-to-one relationship between a Natural source
code statement and the corresponding object code in the cataloged object.
Therefore, multiple Natural statements can be merged into one NS
event and conversely, one Natural statement can cover multiple NS
events.
|
| Inbound RPC Message | RI |
R |
When the Natural RPC server layer receives the client request. |
| Start of RPC Request Execution | RS |
R |
When the Natural RPC server layer calls the Natural server program. |
| Outbound RPC Message | RO |
R |
When the Natural RPC server returns the result to the client. |
| RPC Wait for Client | RW |
R |
When the Natural RPC server waits for the next message from the client. |
| User-Defined Event | U |
U |
When a user-defined event was generated. See Writing User-Defined Events. |
| Monitor Pause | MP |
M |
When the data collection is paused.
A pause event can be caused by an explicit pause request, at the start of a block filter or when the data pool is full. The duration of a pause is not considered for the application performance analysis. |
With each collected event, a CPU and an event timestamp are recorded. In general, a timestamp is taken at the beginning of an event. The duration of an event therefore equals the time that elapses between the timestamp of the event and the timestamp of the event that follows.
This section describes the data collected by the Profiler utility:
- General Data
The following data elements are collected at every event:
Event counter
Event type
Event time in units of microseconds
Session CPU time in units of microseconds
Trace session ID
Natural Security user group ID
Natural user ID
Natural application name
Program library
Program name
Program level
Copycode library
Copycode name
Statement line number
Statement op-code
Coverage flag (for Natural code coverage)
Notes:
- The time spent for data collection (Monitor CPU time) is measured separately and extracted from the session CPU time.
- The events are counted before any filtering or sampling is performed. Therefore, the events receive in general the same counting results regardless of which filtering or sampling is used.
- Statement events are only counted if the event filter keyword
STATEMENT=COUNTis used.- Monitor Pause events are not counted.
- Natural code coverage only collects
NSandPIevents.- Natural code coverage does not collect time values.
- A
PIevent is collected for each object accessed and for all copycodes included in the object (recursively).- Event-Specific Data
The following data is only collected at the following events:
Event Data Elements Session Initialization None Session Termination Termination return code
Natural termination message code NAT99nn
Name of back-end program
Monitor CPU time in units of microsecondsProgram Load Name of program to be loaded
Name of load library
Invocation typeProgram Resume None Program Start/Termination Program type
Database ID of program library
File number of program libraryProgram Information Program type
Number of statements in the program or copycode
First statement item
INCLUDEline number
Parent copycode IDDatabase Call Database type
Command code
Command ID
Database ID
File number
Response code (event typeDA)
Error subcode (event typeDA)
Adabas command time (event typeDA)Terminal I/O Number of bytes sent
Number of bytes read
Total session storage allocated
Compressed session storage lengthExternal Program Call Name of program called
Calling mode such as dynamic or static mode
Program link location
Parameter type such as reference or value
Response code (event typeCA)Runtime Error Natural system error message code
External abend code
Name of error handling programNatural Statement Profiling: None Natural code coverage: Statement item identifier (GP offset)
Start of RPC Request Execution Environment (
C= client,S= server)
Subprogram name
Adabas user ID (ETID)
Conversation status
Logon indicator (Y= logon performed)
Impersonation indicator of RPC request (Y= impersonation performed)Outbound/Inbound RPC Message / RPC Wait for Client Environment (
C= client,S= server)
Transport protocol
RPC function
Type of client user ID
Length of message
RPC return code
External conversation ID
Client user ID
Server node (event typesROandRW)
Server name (event typesROandRW)User-Defined Event Subtype of the user-defined event
Up to 249 bytes of user-defined informationMonitor Pause Type of monitor pause Possible values:
RMonitor pause requested. This value is also set when the session is initialized with the Pause option. FStart of a block of filtered-out events. Block filters are: library, program, line, FNAT, event count, or time filter. WTrace session waits because of a data pool full situation.
The Profiler utility INIT function initializes profiling.
The INIT function must be performed before any of the Profiler
utility functions START, PAUSE or TEXT
or any Profiler filter.
Syntax of INIT:
FUNCTION=INIT |
[RESOURCE={ON|OFF}]
|
[RESOURCE-NAME=resource-name]
|
[RESOURCE-LIB=library-name]
|
[REPLACE={YES|NO}]
|
[SAMPLING={ON|OFF}]
|
[INTERVAL={100|interval-time}]
|
[CONSOLIDATE={ON|OFF}]
|
[WAIT-FULL={60|wait-full-time}]
|
[WAIT-EMPTY={60|wait-empty-time}]
|
[CMPRMIN=data-set-name]
|
[TRACE-EVENT={ON|OFF}]
|
[TRACE-MONITOR={3|trace-level}]
|
[TRACE-CONSOLIDATE={ON|OFF}]
|
Syntax Description:
| Keyword for INIT | Value | Description |
|---|---|---|
RESOURCE |
Specifies whether the event data is to be written to a Natural Profiler resource file (NPRF or NPRC). | |
ON |
The event data is written to a Natural Profiler resource file and can be analyzed with NaturalONE or with the data processing functions of the Natural Profiler utility. | |
OFF |
The event data is not written to a Natural Profiler resource file. This option can be used if only the Profiler event trace or the statistics are required. | |
RESOURCE-NAME |
resource-name |
The name of the Profiler resource file in which
the event data is saved for a later analysis. If the extension
.nprf (Natural Profiler resource file) or .nprc
(Natural Profiler resource consolidated) has not been specified, it is added
automatically. Which extension is used depends on the CONSOLIDATE
keyword.
Default:
where and yyyymmdd_hhiiss is the resource allocation date and time. |
RESOURCE-LIB |
library-name |
The name of the Natural library in which the
resource is allocated.
Default: The name of the current library |
REPLACE |
Specifies whether the resource is replaced if it already exists. | |
YES |
Replace the resource if it exists. | |
NO |
Do not replace the resource. If the resource already exists, a message is written and no profiling is performed. | |
SAMPLING |
Specifies whether the Profiler CPU-time sampling is activated. Sampling can reduce dramatically the number of monitored events whereby it achieves nearly the same CPU-time results. See Sampling. | |
ON |
Activate sampling. | |
OFF |
Deactivate sampling. | |
INTERVAL |
interval-time |
The sampling interval determines at which CPU
timestamp events are collected. If the sampling interval is greater, fewer
events are collected. If the sampling interval is smaller, the resulting CPU
times are more accurate.
Valid values for
Unit: microseconds |
CONSOLIDATE |
Specifies whether the event data is consolidated (aggregated) before it is written to the resource file. See Data Consolidation and Processing in the section Basic Concepts of the Profiler Utility. | |
ON |
The event data is consolidated and written to an NPRC (Natural Profiler resource consolidated) resource file. | |
OFF |
The event data is written unconsolidated to an NPRF (Natural Profiler resource file) resource file. | |
WAIT-FULL |
wait-full-time
|
Specifies how long the trace session waits if
the Profiler data pool is full. If the limit is reached and there is still no
space released, Natural terminates (ABEND S0C1).
The value prevents the trace session from endless waiting on an unexpectedly failed monitor session. Valid values for
Unit: seconds |
WAIT-EMPTY |
wait-empty-time |
Specifies how long the Profiler monitor session
waits if the Profiler data pool is empty and the trace session is still active.
If the limit is reached, a message is written and the profiling is stopped.
A value of zero ( Valid values for
When profiling a batch Natural RPC server or profiling a mainframe
session from Natural Studio, the value is always set to Unit: seconds |
CMPRMIN |
data-set-name |
Specifies the name of the dynamic parameter
input data set for the Profiler monitor session. See
Monitor Session
CMPRMIN.
Default: |
TRACE-EVENT |
Specifies whether the Profiler event trace is
written to the standard output of the Profiler monitor session
(MONPRINT data set). See
Event
Trace.
|
|
ON |
Write the Profiler event trace. | |
OFF |
Do not write the Profiler event trace. | |
TRACE-MONITOR |
trace-level
|
Set the level of the internal trace of the
Profiler monitor session. The internal trace contains information such as
Profiler errors and is written to the standard output of the monitor session
(MONPRINT data set). See
Internal
Trace.
Valid trace levels: |
TRACE-CONSOLIDATE |
Specifies whether the Profiler consolidation
trace is written to standard output. The consolidation trace can only be
written if CONSOLIDATE=ON is specified. See
Consolidation
Trace.
|
|
ON |
Write the Profiler consolidation trace. | |
OFF |
Do not write the Profiler consolidation trace. |
FUNCTION=INIT           /* Initialize Profiling
  RESOURCE=ON           /* Write to resource file
  RESOURCE-NAME='Test'  /* Resource name
  RESOURCE-LIB=PRFDATA  /* Resource library
  REPLACE=YES           /* Replace resource
  SAMPLING=ON           /* Use sampling
  INTERVAL=100          /* Sampling interval
  CONSOLIDATE=OFF       /* Do not consolidate the data
  WAIT-FULL=60          /* Wait sec if pool full
  WAIT-EMPTY=60         /* Wait sec if pool empty
  CMPRMIN=PRFPARMS      /* CMPRMIN for monitor session
  TRACE-EVENT=ON        /* Trace events
  TRACE-MON=3           /* Trace level monitor session
The Profiler utility COVERAGE function initializes the
Natural code coverage. The COVERAGE function must be performed
before any of the Profiler utility functions START,
PAUSE or TEXT or any Profiler filter.
Syntax of COVERAGE:
FUNCTION=COVERAGE |
[RESOURCE={ON|OFF}]
|
[RESOURCE-NAME=resource-name]
|
[RESOURCE-LIB=library-name]
|
[REPLACE={YES|NO}]
|
[WAIT-FULL={60|wait-full-time}]
|
[WAIT-EMPTY={60|wait-empty-time}]
|
[CMPRMIN=data-set-name]
|
[TRACE-EVENT={ON|OFF}]
|
[TRACE-MONITOR={3|trace-level}]
|
[TRACE-COVERAGE={ON|OFF}]
|
Syntax Description:
| Keyword for COVERAGE | Value | Description |
|---|---|---|
RESOURCE |
Specifies whether code coverage data is to be written to a Natural code coverage resource file (NCVF). | |
ON |
Code coverage data is written to a Natural code coverage resource file and can be analyzed with NaturalONE or with the data processing functions of the Natural Profiler utility. | |
OFF |
Code coverage data is not written to a Natural code coverage resource file. This option can be used if only the Profiler event trace or the statistics are required. | |
RESOURCE-NAME |
resource-name |
The name of the Natural code coverage resource
file in which code coverage data is saved for a later analysis. If the
extension .ncvf (Natural code coverage resource file) has not been
specified, it is added automatically.
Default:
where and yyyymmdd_hhiiss is the resource allocation date and time. |
RESOURCE-LIB |
library-name |
The name of the Natural library in which the
resource is allocated.
Default: The name of the current library |
REPLACE |
Specifies whether the resource is replaced if it already exists. | |
YES |
Replace the resource if it exists. | |
NO |
Do not replace the resource. If the resource already exists, a message is written and no code coverage is performed. | |
WAIT-FULL |
wait-full-time
|
Specifies how long the trace session waits if
the Profiler data pool is full. If the limit is reached and there is still no
space released, Natural terminates (ABEND S0C1).
The value prevents the trace session from endless waiting on an unexpectedly failed monitor session. Valid values for
Unit: seconds |
WAIT-EMPTY |
wait-empty-time |
Specifies how long the Profiler monitor session
waits if the Profiler data pool is empty and the trace session is still active.
If the limit is reached, a message is written and code coverage is stopped.
A value of zero ( Valid values for
When covering a batch Natural RPC server or a mainframe session
from Natural Studio, the value is always set to Unit: seconds |
CMPRMIN |
data-set-name |
Specifies the name of the dynamic parameter
input data set for the Profiler monitor session. See
Monitor Session
CMPRMIN.
Default: |
TRACE-EVENT |
Specifies whether the Profiler event trace is
written to the standard output of the Profiler monitor session
(MONPRINT data set). See Tracing Natural Code
Coverage.
|
|
ON |
Write the Profiler event trace. | |
OFF |
Do not write the Profiler event trace. | |
TRACE-MONITOR |
trace-level
|
Set the level of the internal trace of the
Profiler monitor session. The internal trace contains information such as
Profiler errors and is written to the standard output of the monitor session
(MONPRINT data set). See
Internal
Trace.
Valid trace levels: |
TRACE-COVERAGE |
Specifies whether the Profiler coverage trace is written to standard output. See Tracing Natural Code Coverage. | |
ON |
Write the Profiler coverage trace. | |
OFF |
Do not write the Profiler coverage trace. |
FUNCTION=COVERAGE       /* Initialize code coverage
  RESOURCE=ON           /* Write to resource file
  RESOURCE-NAME='Test'  /* Resource name
  RESOURCE-LIB=COVDATA  /* Resource library
  REPLACE=YES           /* Replace resource
  WAIT-FULL=60          /* Wait sec if pool full
  WAIT-EMPTY=60         /* Wait sec if pool empty
  CMPRMIN=PRFPARMS      /* CMPRMIN for monitor session
  TRACE-EVENT=ON        /* Trace events
  TRACE-MON=3           /* Trace level of monitor session
  TRACE-COVERAGE        /* Trace coverage data
The Profiler must be initialized before the data collection can be started or paused. Because the data collection is paused after the initialization, it has to be started in any way so that event data is recorded.
You can start and pause data collection with the following methods:
The Profiler utility START and PAUSE
functions are used to start and pause data collection. The following syntax
applies:
|
|
Syntax Description:
| Keyword for START | Value | Description |
|---|---|---|
COUNT |
count-number
|
Set the event counter of the next monitored
event to the specified value.
Valid values for
The event counter remains unchanged if a value of zero
( |
The following Natural programs in the system library
SYSPRFLR are supplied to perform Profiler utility functions:
| Program | Description |
|---|---|
| PRFSTART | Start the data collection. |
| PRFPAUSE | Pause the data collection. |
| PRFSTATE | Get the state of the data collection. |
| PRFFCT | Execute a Profiler utility function:
START, PAUSE or STATE.
|
![]() To use Profiler utility programs
To use Profiler utility programs
Logon to the library SYSPRFLR or copy the programs to
the library SYSTEM, to the appropriate steplib library, or to the
required library.
If PRFFCT is used, the application programming
interface USR8210N has to be copied as well (see the following
section).
If PRFFCT is used in a client/server environment, copy
PRFFCT to the client library and USR8210N to the
server library.
Note:PRFFCT expects as input the value
START, PAUSE or STATE to perform the
corresponding function.
![]() To start the data collection
To start the data collection
Execute the following program:
PRFSTART
Or:
PRFFCT
START
![]() To pause the data collection
To pause the data collection
Execute the following program:
PRFPAUSE
Or:
PRFFCT
PAUSE
![]() To retrieve the current state of the data collection
To retrieve the current state of the data collection
Execute the following program:
PRFSTATE
Or:
PRFFCT
STATE
The data collection can be started and paused from the profiled Natural
application by calling the application programming interface (API)
USR8210N. The API can also be used to get the current state of the
monitoring process. The API is delivered in the SYSEXT library.
For more information, see SYSEXT Utility - Natural Application
Programming Interfaces.
![]() To use the API
To use the API
Copy the subprogram USR8210N to the library
SYSTEM, to the appropriate steplib library, or to the required
library.
Note:USR8210N expects as the first parameter the value
START, PAUSE or STATE to perform the
corresponding function. The parameter values can be specified in uppercase or
lowercase. On return, P-RETURN contains the return code and
P-MESSAGE the success or error message.
![]() To start the data collection
To start the data collection
Use the interface with the CALLNAT statement:
CALLNAT 'USR8210N' 'START' P-RETURN P-MESSAGE /* Start Profiler
![]() To pause the data collection
To pause the data collection
Use the interface with the CALLNAT statement:
CALLNAT 'USR8210N' 'PAUSE' P-RETURN P-MESSAGE /* Pause Profiler
![]() To retrieve the current state of the data collection
To retrieve the current state of the data collection
Use the interface with the CALLNAT statement:
CALLNAT 'USR8210N' 'STATE' P-RETURN P-MESSAGE /* Get Profiler state
The state is coded in the field P-RETURN:
| P-RETURN | Description |
|---|---|
0
|
Natural Profiler data collection is started. |
1 |
Natural Profiler data collection is paused. |
Filters play an important role in reducing the amount of collected data. The following filters are available:
Note:
The Profiler must be initialized before any settings can be applied
to a specific filter.
The Profiler event filter specifies which events are collected. Additionally, it determines whether event data is recorded while Natural system programs are executing.
Syntax of Event Filter:
FILTER=EVENT |
[EVENT={[event-type]...|ALL}
|
[STATEMENT={ON|OFF|COUNT}]
|
[FNAT={ON|OFF}
|
Syntax Description:
| Keyword for EVENT | Value | Description |
|---|---|---|
EVENT |
Specifies which events are collected. | |
event-type |
Each event is encoded by a one or two letter
code. Multiple events are separated by blanks. Only the specified events are
recorded. If no event is given, the Profiler monitors only the session and
pause events.
Possible event entries are: Notes:
|
|
ALL |
All events are recorded; that is, the
definition is equivalent to
EVENT=DB DA PL PS PT PR IB IA E CB CA U RS RI RO Caution: |
|
STATEMENT |
Specifies whether Natural statement
(NS) events are collected.
|
|
ON |
Natural statement (NS) events are
collected but not counted. Only non-statement events are counted. Natural
statement events receive the same count as the preceding event.
|
|
OFF |
Natural statement (NS) events are
not collected.
|
|
COUNT |
Natural statement (NS) events are
collected and counted, that means, the event counter field in the event record
is incremented with each statement event. This option can lead to poorer
performance. See Profiler Performance in
Batch.
|
|
FNAT |
Specifies whether event data is recorded while Natural system programs are executing. | |
ON |
Event data is recorded while Natural system programs are executing. | |
OFF |
Event data is not recorded while Natural system programs are executing. |
- Default Filter Value for Profiling
By default (if the event filter is not specified), all events except Natural statement events are collected and event data of Natural system programs is not recorded:
FILTER=EVENT /* Set event filter EVENT=ALL /* All events STATEMENT=OFF /* Do not collect statements FNAT=OFF /* No FNAT- Default Filter Value for Code Coverage
By default (if the event filter is not specified), only program start and Natural statement events are collected. Event data of Natural system programs is not recorded:
FILTER=EVENT            /* Set event filter
  EVENT=PS              /* Program start only
  STATEMENT=ON          /* Collect statements
  FNAT=OFF              /* No FNAT
Code coverage will not work correctly if program start or Natural statement events are not collected. If other events are monitored, they will be displayed in the trace but ignored by code coverage.
- Example of an Event Filter
The Profiler program filter specifies the libraries, programs (Natural objects) and program lines for which event data is collected. By default (if the program filter is not specified), the data of all libraries, programs and lines is collected.
Syntax of Program Filter:
FILTER=PROGRAM |
[LIBRARY=library-name]
|
[PROGRAM=program-name]
|
[LINE-FROM={0|start-number}
|
[LINE-TO={0|end-number}
|
Syntax Description:
The following example monitors the lines 0500 to
2000 in all Natural objects starting with X on the
library PRFDEMO.
FILTER=PROGRAM            /* Set program filter
  LIBRARY=PRFDEMO         /* Monitored library
  PROGRAM=X*              /* Monitored program
  LINE-FROM=500           /* Monitor from line 0500
  LINE-TO=2000            /* Monitor to line 2000
The Profiler count filter specifies the event counters for which data is collected. By default (if the count filter is not specified) the data of any event count is collected.
If the event filter STATEMENT=ON is set,
the count filter can only refer to non-statement events because statement
events do not get a unique count. The non-statement events have the same count
as with STATEMENT=OFF and the same count filter can be used in
both cases.
Syntax of Count Filter:
FILTER=COUNT |
[FROM={0|minimum-count}
|
[TO={0|maximum-count}
|
Syntax Description:
A profiling with STATEMENT=OFF has shown that a lot of CPU
time was spent between the events with the counters 1200 to 1400. Now, we want
to analyze this range in more detail including the statements. With
STATEMENT=COUNT, the statements would be counted as well and the
events would receive other counter values. But with STATEMENT=ON
the statements are not counted and the counter values can be used to restrict
the data collection.
FILTER=COUNT            /* Set count filter
  FROM=1200             /* Monitor from event count 1200
  TO=1400               /* Monitor to event count 1400
The Profiler time filter specifies the CPU-times (in units of 1/100 sec) for which data is collected. By default (if the time filter is not specified), the data of any CPU time is collected.
Syntax of Time Filter:
FILTER=TIME |
[FROM={0|minimum-time}
|
[TO={0|maximum-time}
|
Syntax Description:
The following example monitors all events which occur after one second for the duration of two seconds.
FILTER=TIME            /* Set time filter
  FROM=100             /* Monitor from CPU second 1.00
  TO=300               /* Monitor to CPU second 3.00
The sampling method uses a statistical approach to collect data. Sampling significantly reduces the amount of data written to the resource file while approximately retaining the same CPU times as without sampling.
Sampling is available for profiling but not for code coverage.
For general information regarding sampling, see Sampling in the section Basic Concepts of the Profiler Utility.
![]() To enable sampling
To enable sampling
Enter the following subordinate keywords associated to the Profiler
utility INIT function:
SAMPLING=ON
INTERVAL=nnn
where nnn is the sampling
interval in microseconds.
Note:
By default (if SAMPLING is not specified), the data
is not sampled. If SAMPLING=ON is specified but no
INTERVAL, the default sampling interval is 100 microseconds.
A user-defined event can be generated from a Natural program by using the Natural statement
CALL 'CMRDC' 'U' USER-DATA
The first character of the USER-DATA is treated as the
subtype of the user-defined event. The remaining characters are the text of the
user-defined event. For details, see
User-defined Events
in the SYSRDC Utility
documentation.
Notes:
The Profiler utility FUNCTION=TEXT function is used to
write user-defined events. The following syntax applies:
FUNCTION=TEXT |
[TEXT=text]
|
[TYPE=character]
|
Syntax Description:
| Keyword for TEXT | Value | Description |
|---|---|---|
TEXT |
text |
The text
is added to the Profiler trace as a user-defined event. If multiple
TEXT keywords are specified, the corresponding values are
concatenated. The maximum text size is 249 bytes. Additional characters will be
truncated.
Default: none (blanks) |
TYPE |
character |
The alphanumeric
character specifies the subtype of the
user-defined event. The subtype is part of the event-specific data. The event
type of a user-defined event is always U followed by a blank.
Default: blank |
Use the following event filter setting if you only want to monitor the
user-defined events written with the TEXT function. In addition to
the TEXT function entries, the session and pause events are also
monitored. All other events, including user-defined events written by calls to
CMRDC are filtered out.
* Monitor only TEXT function entries
FILTER=EVENT/* Set event filter
  EVENT=                /* No events
  STATEMENT=OFF         /* No statements
  FNAT=OFF              /* No FNAT
The following example writes a user-defined event with subtype
J and the text Start profiling into the Profiler
event trace.
FUNCTION=TEXT            /* Write a user-defined event
  TEXT='Start profiling' /* User-defined event text
  TYPE='J'               /* User-defined event subtype
By default, the Profiler monitor session uses the same dynamic Natural
parameters as the trace session specified with the CMPRMIN input
data set. Exception: the RDCSIZE profile parameter is
set to zero (0) for the monitor session. With the
CMPRMIN keyword of the Profiler utility INIT or
COVERAGE function a separate dynamic parameter input data set can
be defined for the Profiler monitor session. If you use the separate dynamic
parameter input data set, consider the following:
Specify for the monitor session only those Natural parameters which
are required. Do not specify parameters required for the application execution
(such as RPC).
Specify the RDCSIZE and RDCEXIT parameters
only for the trace session. Specifying these parameters for the monitor session
will lead to unnecessary calls to the exit and a poorer performance.
Specify the PDPSIZE parameter only for the monitor
session. Any specification in the trace session dynamic parameter input data
set is ignored.
If the default Natural profile parameter ETID setting is
used, it can happen that the following error is received by the Profiler
monitor session:
NAT3048 Error during Open processing. DB/Subcode
                          nn/8 -
                          ETID=job-name.
In this case, use the following parameters for CMPRMIN:
ETID=' ',DBCLOSE=ON
Alternatively, you can use an ETID value different from the
job name in the separate dynamic parameter input data set for the Profiler
monitor session.
![]() To define a dynamic parameter input data set for the Profiler monitor
session
To define a dynamic parameter input data set for the Profiler monitor
session
Enter the following subordinate keyword associated to the Profiler
utility INIT or COVERAGE function:
CMPRMIN=data-set
where data-set is the name of
the dynamic parameter input data set for the Profiler monitor session.
//CMSYNIN  DD  *
PROFILER
FUNCTION=INIT             /* Initialize profiling
  CMPRMIN=PRFPARMS        /* Monitor session parameter
  ...
/*
//* Trace Session Parameters
//CMPRMIN  DD   *
RDCSIZE=2,RDCEXIT=NATRDC1,...
/*
//* Monitor Session Parameters
//PRFPARMS DD   *
ETID=PROFILER,PDPSIZE=10000,...
/*
Profiling or performing code coverage of a batch Natural RPC server
requires that the PROFILER system command and the
Profiler input data are entered with the Natural
STACK profile
parameter in the RPC server job. The Profiler input must be entered in the
second syntax format (without equal signs and commas). See also
Profiler Utility
Syntax in Syntax and
Keywords.
![]() To start profiling of a batch Natural RPC server
To start profiling of a batch Natural RPC server
Enter the following keyword before the Profiler INIT or
COVERAGE function is performed:
RPC
The RPC keyword indicates the Profiler that a Natural RPC server is
monitored. The Profiler overwrites the WAIT-EMPTY keyword of the
initialization with a value of zero (0) so that profiling always
continues when the Profiler data pool is empty and the trace session is still
active.
We recommend that you use a separate dynamic parameter input data set
(Monitor Session
CMPRMIN) for the Profiler monitor session when profiling a
batch Natural RPC server. Do not specify the RPC
parameter in this data set. See
Monitor Session
CMPRMIN.
The event data of the batch Natural RPC server is written to a Profiler resource file. The name and library of the resource file can be specified with Profiler keywords (see Initializing Profiling). We recommend that you stop the Natural RPC server before the Profiler further processes the resource file.
If you profile a Natural RPC server, you can start and pause data collection with the programs supplied for the Profiler utility.
![]() To start and pause Profiler data collection in a client/server
environment
To start and pause Profiler data collection in a client/server
environment
Copy the program PRFFCT from the system library
SYSPRFLR to the client library, and the application programming
interface USR8210N from the system library SYSEXT to
the server library.
Execute the program PRFFCT in the client library.
PRFFCT expects as input the value START or
PAUSE to perform the corresponding function. If you enter the
value STATE, the current state of the data collection is
displayed.
For more information, see Starting and Pausing Data Collection.
The following example for z/OS shows the Profiler input data for a
batch Natural RPC server specified with the Natural
STACK profile
parameter:
STACK=(
PROFILER RPC:
TRACE:3:
FUNCTION:INIT:
  TRACE-EVENT:OFF:
  TRACE-MON:3:
  CMPRMIN:CMPRMINX:
  RESOURCE:ON:
  RESOURCE-NAME:RPCTEST:
  RESOURCE-LIB:PRFDATA:
  REPLACE:YES:
FILTER:EVENT:
  EVENT:ALL:
  STATEMENT:ON:
  FNAT:OFF:
END-PROFILER;
LOGON PRFDEMO
)
You can use the Profiler utility in batch mode to profile a mainframe application or run code coverage for a mainframe application that executes remotely from Natural Studio on a Natural Development Server.
This requires that you specify the PROFILER
system command and the PROFILER input data with the
Natural STACK profile
parameter dynamically set when you map your remote mainframe environment. The
Profiler input must be entered in the second syntax format (without equal signs
and commas). See also Profiler Utility
Syntax in Syntax and
Keywords.
You can use the Profiler INCLUDE keyword to read the
Profiler input from a Natural text object, and thus reduce the amount of data
entered with the STACK parameter. For an example, see
the XNDV text object delivered in the SYSPRFLR system
library. This example initializes the profiling and immediately starts the
monitoring.
The Profiler automatically overwrites the
WAIT-EMPTY keyword of
the initialization with a value of zero (0) so that profiling
always continues when the Profiler data pool is empty and the trace session is
still active.
The event data of the Natural Studio mainframe session is written to a Profiler resource file. The name and library of the resource file can be specified with Profiler keywords (see Initializing Profiling or Initializing Code Coverage). We recommend that you disconnect the mainframe session before you evaluate the resource file.
If you profile a Natural Studio mainframe session, you can start and pause data collection (see the relevant section) with the programs supplied for the Profiler utility.
![]() To start and pause Profiler data collection in a Natural Studio
mainframe session
To start and pause Profiler data collection in a Natural Studio
mainframe session
Logon to the library SYSPRFLR.
Execute the PRFSTART program to start the
collection.
Execute the PRFPAUSE program to pause the
collection.
The following rules and restrictions apply when profiling a mainframe session from Natural Studio:
Profiling with the Profiler utility in batch mode does not work if programs are executed remotely from NaturalONE. Use the NaturalONE Profiler if you want to profile mainframe programs executed in a NaturalONE environment.
Profiling of a Natural Studio mainframe session with the Profiler utility in batch mode does not work if the Natural Development Server uses a CICS adapter.
If profiling is started with the STACK parameter, use
the TRACE=0 Profiler setting.
The monitor trace (TRACE-MONITOR) of the Profiler
session is written to the Natural Development Server output.
The following is an example of a STACK parameter
specification for Profiler input data set dynamically when mapping to a remote
mainframe environment from Natural Studio:
STACK=(PROFILER RESOURCE-LIB:PRFDATA:INCLUDE:XNDV)
The resource is written to the PRFDATA library.
The Profiler utility CONSOLIDATE function consolidates
event data.
For general information regarding data consolidation, see Data Consolidation in the section Basic Concepts of the Profiler Utility.
Syntax of CONSOLIDATE:
FUNCTION=CONSOLIDATE |
[RESOURCE={ON|OFF}]
|
[RESOURCE-NAME=resource-name]
|
[RESOURCE-LIB=library-name]
|
[REPLACE={YES|NO}]
|
[IO-TIME={ON|OFF}]
|
[EXPORT={ON|OFF}]
|
[FORMAT={TEXT|COMMA|SEMICOLON}]
|
[TRACE-EVENT={ON|OFF}]
|
[TRACE-CONSOLIDATE={ON|OFF}]
|
Syntax Description:
| Keyword for CONSOLIDATE | Value | Description |
|---|---|---|
RESOURCE |
Specifies whether the consolidated event data is written to a Natural Profiler resource consolidated (NPRC) resource file. | |
ON |
The consolidated event data is written to an NPRC resource file. | |
OFF |
The consolidated event data is not written to an
NPRC resource file.
This setting is useful if you want to print the event trace or statistics or export the data and you do not need the consolidated NPRC resource file. |
|
RESOURCE-NAME |
resource-name |
The name of the Natural Profiler resource file
(NPRF) you want to consolidate.
The file extension Default: The name of the last created NPRF resource file in the library If |
RESOURCE-LIB |
library-name |
The name of the Natural library that contains the
NPRF resource file you want to consolidate.
Default: The name of the current library. This library is also used as the target library for the consolidated NPRC resource file. |
REPLACE |
Specifies whether an existing NPRC resource file is replaced. | |
YES |
Replace an existing NPRC resource file with the same name. | |
NO |
Do not replace an existing NPRC resource file
with the same name.
A message is returned if a resource file with the same name already exists. No consolidation is performed in this case. |
|
IO-TIME |
Specifies whether I/O times (IB
event) and Natural RPC client times (RW event) are included in the
consolidated data.
|
|
ON |
I/O and Natural RPC client time are included in the consolidated data. | |
OFF |
I/O and Natural RPC client time are not included
in the consolidated data.
This setting is useful if the event data originates from
the Profiler utility in online mode and you plan to analyze the performance in
NaturalONE or with the Profiler utility |
|
EXPORT |
Specifies whether the consolidated event data is written to Work File 7. | |
ON |
Write to Work File 7. | |
OFF |
Do not write to Work File 7. | |
FORMAT |
Specifies the format in which the exported data is written to Work File 7. | |
TEXT |
Write the data in free text format. | |
COMMA |
Write the data in CSV format with a comma
(,) separator.
|
|
SEMICOLON |
Write the data in CSV format with a semicolon
(;) separator.
|
|
TRACE-EVENT |
Specifies whether the Profiler event trace is
written to standard output.
See Event Trace. |
|
ON |
Write the Profiler event trace. | |
OFF |
Do not write the Profiler event trace. | |
TRACE-CONSOLIDATE |
Specifies whether the Profiler consolidation trace is written to standard output. See Consolidation Trace. | |
ON |
Write the Profiler consolidation trace. | |
OFF |
Do not write the Profiler consolidation trace. |
The following example consolidates the Profiler resource
Test.nprf in the library PRFDATA and writes the
consolidated data to the Profiler resource Test.nprc. I/O and
Natural RPC client times are included in the consolidated data.
In addition, the consolidated data is written in CSV (semicolon-separated values) format to Work File 7.
The event and consolidation traces are switched off.
FUNCTION=CONSOLIDATE    /* Consolidate Profiler data
  RESOURCE=ON           /* Write to resource
  RESOURCE-NAME='Test'  /* Resource name
  RESOURCE-LIB=PRFDATA  /* Resource library
  REPLACE=YES           /* Replace resource
  IO-TIME=ON            /* Include I/O and RPC client times
  EXPORT=ON             /* Write to Work File 7
  FORMAT=S              /* CSV format with semicolon separator
  TRACE-EVENT=OFF       /* No event trace
  TRACE-CONSOLIDATE=OFF /* No consolidation trace
When a Natural application is profiled, the Natural Profiler utility
writes the event data to an NPRF resource file. Consolidated data is stored in
an NPRC resource file and coverage data is stored in an NCVF resource file. The
Profiler utility READ function reads and evaluates the Profiler
resource data and writes the results to standard output or to a Natural work
file. The evaluations performed depend on the type of the resource file read as
described in the following table:
| Resource File Type | Evaluation | Description |
|---|---|---|
| NPRF | Event trace | Chronological list of the Profiler event data |
| Program trace | Program flow of the profiled application | |
| Statistics | Statistics of profiling and the NPRF resource file | |
| NPRC | Consolidation trace | List of the consolidated data with hit counts and summarized elapsed time and CPU time |
| Program summary | Table of executed Natural objects
The table shows which events occurred during object execution and the CPU time spent executing the object. |
|
| Statistics | Statistics of profiling, the consolidation and the NPRC resource file | |
| NCVF | Statement coverage | List of statements covered in in the source lines
The list shows the percentage of statement coverage for each statement line in the source of the accessed programs. |
| Program coverage | Table of code coverage results of executed
Natural objects
The program coverage table lists all Natural objects which have been executed during the coverage run. For each object, it shows the percentage of coverage, the number of covered and missed statements, and the total number of statements. |
|
| Statistics | Statistics for profiling, coverage and the NCVF resource file |
This section covers the following topics:
The Profiler utility READ function reads and evaluates the
resource data.
Syntax of READ:
FUNCTION=READ |
[RESOURCE-NAME=resource-name]
|
[RESOURCE-LIB=library-name]
|
[RESOURCE-TYPE={NPRF|NPRC|NCVF}]
|
[EVENT={ON|OFF}]
|
[PROGRAM={ON|OFF}]
|
[STATISTICS={ON|OFF}]
|
[PRINT={ON|OFF}]
|
[EXPORT={ON|OFF}]
|
[FORMAT={TEXT|COMMA|SEMICOLON}]
|
Syntax Description:
| Keyword for READ | Value | Description |
|---|---|---|
RESOURCE-NAME |
resource-name |
The name of the NPRF, NPRC or NCVF resource file
you want to read.
If no file extension is specified, the extension specified with
the keyword Default: The name of the last created NPRF, NPRC or NCVF resource
file in the library depending on the |
RESOURCE-LIB |
library-name |
The name of the Natural library that contains
the NPRF, NPRC or NCVF resource you want to read.
Default: The name of the current library |
RESOURCE-TYPE |
Specifies the default resource type (extension)
to use if no extension is specified with RESOURCE-NAME.
|
|
NPRF |
The default resource type is NPRF with extension
.nprf.
|
|
NPRC |
The default resource type is NPRC with extension
.nprc.
|
|
NCVF |
The default resource type is NCVF with extension
.ncvf.
|
|
EVENT |
Specifies whether the Natural Profiler evaluates
events.
See also Event Trace, Consolidation Trace and Statement Coverage. |
|
ON |
NPRF: Write the Natural Profiler event trace. |
|
OFF |
Do not evaluate events. | |
PROGRAM |
Specifies whether the Natural Profiler evaluates
programs.
See also Program Trace, Program Summary and Program Coverage. |
|
ON |
NPRF: Write the Natural Profiler program trace. |
|
OFF |
Do not evaluate programs. | |
STATISTICS |
Specifies whether the Natural Profiler writes
statistics.
See also Profiler Statistics. Note: |
|
ON |
Write statistics. | |
OFF |
Do not write statistics. | |
PRINT |
Specifies whether the result is written to standard output. | |
ON |
Write to standard output. | |
OFF |
Do not write to standard output. | |
EXPORT |
Specifies whether the evaluated data is written to the Work File 7. | |
ON |
Write to Work File 7. | |
OFF |
Do not write to Work File 7. | |
FORMAT |
Specifies the format in which the exported data is written to Work File 7. | |
TEXT |
Write the data in free text format. | |
COMMA |
Write the data in CSV format with a comma
(,) separator.
|
|
SEMICOLON |
Write the data in CSV format with a semicolon
(;) separator.
|
The following example reads the Natural Profiler resource
Test.nprf in the library PRFDATA and writes the event
trace, program trace and the Profiler statistics to standard output and to Work
File 7 in text format.
FUNCTION=READ           /* Read Profiler Data
  RESOURCE-NAME='Test'  /* Resource name
  RESOURCE-LIB=PRFDATA  /* Resource library
  RESOURCE-TYPE=NPRF    /* Use resource type NPRF
  EVENT=ON              /* Print event trace
  PROGRAM=ON            /* Print program trace
  STATISTICS=ON         /* Print statistics
  PRINT=ON              /* Write to standard output
  EXPORT=ON             /* Write to Work File 7
  FORMAT=TEXT           /* Export in text format
If EVENT=ON is specified for an NPRF resource file, the
Profiler event trace is generated.
The event trace shows the data of each Natural event which occurred while the application executed. The trace can be referenced if detailed information of an event is required. For example, if a Natural error occurred during application execution, the event trace shows the corresponding error number and message.
If the event trace is written to standard output
(PRINT=ON) or exported in text format (EXPORT=ON,
FORMAT=TEXT), it is similar to the event trace written by the
Profiler monitor session while the application was profiled (see
Event
Trace. If the data is exported in CSV (comma-separated
values) format, it contains all data fields provided by the Profiler (see
Data
Collected).
- Example of an Event Trace
The following example shows an extract of an event trace:
Natural Profiler Event Trace
----------------------------
     Count Time              CPU-Time (ms) Ev Lev Library  Program  Line CC-Lib   CC-Name  Statement  Local-Data
         0 10:20:58.219911        63.318   MP 003 SYSPRFD  PRBINIT  8350                   Call       Monitor pause requested
       102 10:20:58.277586        76.106   PL 000                   0000                              Execute SYSEDMD/MENU
       103 10:20:58.277591        76.139   PS 001 SYSEDMD  MENU     0000                   PgmStart   00010/02430 Type: P
       103 10:20:58.277594        76.151   NS 001 SYSEDMD  MENU     0250                   Compute    Assign/Compute/Move
       103 10:20:58.277596        76.155   NS 001 SYSEDMD  MENU     0270                   Fetch      Fetch
       104 10:20:58.277598        76.169   DB 001 SYSEDMD  MENU     0270                   Fetch      00010/02430 S1
...
Explanations:
The Count column shows the number of the event. Monitor Pause (
MP) events and Natural Statement (NS) events are not counted and receive the number of the previous event.The Time and CPU-Time columns show the event time and the CPU timestamp of the event execution, respectively.
The event with the number
104is a Database Before (DB) event caused by an Adabas S1 command issued against the file00010/02430which was triggered by aFETCHstatement in the line0270of the Natural objectMENU.For further explanations of the trace columns and event types, see the sections Event Trace and Events and Data Collected.
If EVENT=ON is specified for an NPRC resource file, the
Natural Profiler consolidation trace is generated. The consolidation trace is
also generated if CONSOLIDATE=ON and
TRACE-CONSOLIDATE=ON are set for the Profiler utility
INIT function, or if TRACE-CONSOLIDATE=ON is
set for the Profiler utility CONSOLIDATE function.
The consolidation trace shows general event data, summarized values of the elapsed time and CPU time and the hit count of the consolidated record. If two trace entries show the same general event data, they have different event-specific data which is not displayed in the consolidation trace.
The consolidated records are used as the basis for further evaluations like the NaturalONE hot spots or the Natural Profiler MashApp. The consolidation trace can be used to validate the consolidated data.
If the consolidation trace is written to standard output
(PRINT=ON), it is similar to the consolidation trace written by
the Profiler data consolidation (see Consolidating Event
Data. If the data is exported, it contains all
consolidated data fields provided by the Profiler.
- Example of a Consolidation Trace
The following example shows an extract of a consolidation trace:
Natural Profiler Consolidation Trace
------------------------------------
    Count Ev User     Lev Library  Program  Line CC-Lib   CC-Name  Statement   Hit-Count  Elapsed(ms)      CPU(ms)
        1 DA PRFO82D  000                   0000                                       1       75.692        0.870
        2 DA PRFO82D  000                   0000                                       1        0.002        0.004
        3 DA PRFO82D  000                   0000                                       1        0.006        0.025
        4 NS PRFO82D  006 SYSLIBS  A82CLS   0010 SYSAOSSU C-COPYRT Reset              43        0.043        0.118
        5 NS PRFO82D  006 SYSTEM   NOMSTCS  4360                   End                 1        0.000        0.003
        6 PL PRFO82D  006 SYSTEM   NOMSTCS  0970                   Callnat             1        0.008        0.058
        7 PL PRFO82D  006 SYSTEM   NOMSTCS  1020                   Perform             1        0.004        0.017
...
Explanations:
The Count column shows the number of the consolidated record.
The consolidated record
4shows that theRESETstatement in the line0010of the copycodeC-COPYRT(embedded in the Natural objectA82CLS) executed43times spending a total elapsed time of0.043milliseconds (ms) and a total CPU time of0.118ms.The application was running on a z/OS machine with zIIP (IBM System z Integrated Information Processor). Under this condition, the CPU time can be higher than the elapsed time.
For further explanations of the trace columns and event types, see the sections Event Trace and Events and Data Collected.
If PROGRAM=ON is specified for an NPRF resource file, the
Profiler program trace is generated. The program trace shows the program flow
of the profiled application. In general, the program trace exclusively shows
program and session events (see Events and Data
Collected for a list of possible event types).
If the program trace is written to standard output
(PRINT=ON) or exported in text format (EXPORT=ON,
FORMAT=TEXT), the program names are indented (see the example
below) according to the program level to provide a quick overview of the
application calling structure.
If the data is exported in CSV (comma-separated values) format, the program names are not intended. In addition to the output in text format, the exported data contains the CPU timestamp and the summarized Adabas time.
- Example of a Program Trace
The following example shows an extract of a program trace and the totals of the application run:
Explanations:
For each event listed, the time when the event occurred, the active library, program (Natural object), copycode, line number and program level is displayed.
The program name is followed by the number of events that occurred from one program event to the next program event.
Events which belong to one event group are combined into one count using the maximum count of the corresponding event types. Example: One Database Before (
DB) and one Database After (DA) event are combined into one Database event (D=1).In the example above, the Natural object
OPTTESTwas started at the level1. This program calls the subprogramCALLMON3which calls further subprograms. The highest Level 8 is reached when the subprogramNAT41004executes. During the first execution, this subprogram performs 10 database calls (D=10), 6 external program calls (C=6) and 7345 Natural statements (N=7345).The
Totalssection at the end of the program trace shows the maximum count of each event group. For example: a total of2140database calls corresponds to 2140 Database Before (DB) and 2140 Database After (DA) events.The totals of the Session (
S) and Program (P) event groups are only listed underTotals; they are not listed next to the program name.For further explanations of the trace columns, see the section Event Trace.
For explanations of event types and associated event groups, see the section Events.
If PROGRAM=ON is specified for an NPRC resource file, the
Profiler program summary is generated.
The program summary shows for each Natural object how many Natural events have occurred, the total CPU time (in units of milliseconds) and the percentage of the CPU time spent by the Natural object with respect to the total CPU time.
Monitor Pause events and events at Level 0 are not taken into account for the program summary. Events which belong to one event group are combined into one count: see Events.
Program starts and load requests are listed separately.
If the data is exported in CSV (comma-separated values) format, the count of each event type is listed. Additionally, the elapsed time and the Adabas times (absolute and percentage values) are displayed. The exported time values are indicated in units of µs (microseconds).
- Example of a Program Summary
The following example shows an extract of a program summary:
Explanations:
The Natural object
MONADAconsumed the most CPU time:680.214ms which corresponds to25.98percent of the total CPU time.
MONADAwas started once, it loaded3176other Natural objects, performed71database calls and272180Natural statements. There was no I/O, no external call and no error in the program.At the end of the program summary, the
Totalcounts of the profiling are listed.
The program coverage table is generated if PROGRAM=ON is
specified for an NCVF resource file.
The program coverage table shows the code coverage results for each
accessed Natural object. If the table is given in text format, only the GP
coverage results (copycodes included) are displayed. In CSV (comma-separated
values) format, the table shows lines containing copycode values, additional
columns with source counters (copycodes not included) and information regarding
INCLUDE statements.
In text format, the table provides the coverage count for each accessed library and for the whole application.
The table contains the following columns:
| Column | Description | |
|---|---|---|
| Evaluation | The type of evaluation. Possible types are: | |
| Program | For program coverage data | |
| Event | For statement coverage data | |
| Statistics | For Profiler statistics data | |
| Object Count | The count of cataloged objects (GPs) listed in the table. | |
| Object Type | The type of Natural object such as program and subprogram. | |
| Library | The Natural library that contains the object. | |
| Object | The name of the Natural object. | |
| Copycode ID | The unique identifier of the
copycode instance in the cataloged object (GP). The program gets the copycode
ID 0.
|
|
| Copycode Library | The library from which the copycode is included. | |
| Copycode Name | The name of the copycode. | |
| GP Coverage% | The percentage of object coverage
whereby INCLUDE statements are resolved.
|
|
| GP Covered | The number of covered (executed)
statements whereby INCLUDE statements are resolved.
|
|
| GP Missed | The number of missed (not
executed) statements in the object whereby INCLUDE statements are
resolved.
|
|
| GP Total | The total number of all executable
statements in the object whereby INCLUDE statements are resolved.
|
|
| Src Coverage% | The percentage of object coverage
whereby INCLUDE statements are not resolved.
|
|
| Src Covered | The number of covered (executed)
statements whereby INCLUDE statements are not resolved.
|
|
| Src Missed | The number of missed (not
executed) statements in the object whereby INCLUDE statements are
not resolved.
|
|
| Src Total | The total number of all executable
statements in the object whereby INCLUDE statements are not
resolved.
|
|
| First Statement | The ID of the first statement of the object or copycode. | |
| INCLUDE CC-ID | For copycode only.
The copycode ID of the object or copycode that includes the copycode. |
|
| INCLUDE Object | For copycode only.
The name of the object or copycode that includes the copycode. |
|
| INCLUDE Line | For copycode only.
The line number of the |
|
The following example shows the result of program coverage in text format:
Program Coverage
----------------
Library  Object   Ty Coverage%  Covered    Missed    Total
COVDEMO  TESTCOVN N      84.0%       37         7       44
COVDEMO  TESTCOVP P      69.2%        9         4       13
COVDEMO  -------- --     80.7%       46        11       57
Totals   -------- --     80.7%       46        11       57
Explanations:
The application accesses two objects, the TESTCOVN
subprogram (N) and the TESTCOVP program
(P).
In TESTCOVN, there are 44 executable statements (object
code instructions) from which 37 were covered (executed) and 7 missed (not
executed), giving a total coverage of 84.0%.
The summarized values of the two objects accessed in the library
COVDEMO show coverage of 80.7%.
Total coverage is also 80.7% because only one library is accessed by the objects.
Statement coverage is generated if EVENT=ON is specified
for an NCVF resource file.
For statement coverage, the Profiler utility reads the source of the
monitored objects. If the source is not found or if the source does not match
the collected data, source lines are not printed in the statement coverage
report. The Profiler utility resolves INCLUDE statements and
merges the source of the corresponding copycode into the including program. If
the INCLUDE structure cannot be resolved, the copycodes are
printed separately.
We recommend that you perform the READ function soon after
the coverage run, as long as the sources correspond to the monitored GPs. As
soon as the sources have been modified, the Profiler utility can no longer
provide the full information.
Statement coverage shows the percentage of statements covered for each source line of the accessed programs. If the result is written in text format, for each object listed in the statistics, the object coverage values are shown before the statement coverage data. If the result is written in CSV (comma-separated values) format, additional information regarding statement coverage is provided.
The table contains the following columns:
| Column | Description | |
|---|---|---|
| Evaluation | The type of evaluation. Possible types are: | |
| Program | For program coverage data | |
| Event | For statement coverage data | |
| Statistics | For Profiler statistics data | |
| Object Count | The count of objects (GPs) listed in the table. | |
| Library | The Natural library that contains the objects. | |
| Object | The name of the Natural object. | |
| Copycode ID | The unique identifier of the
copycode instance in the related cataloged object. The program gets the
copycode ID 0.
|
|
| Copycode Library | The library that contains the copycode (if copycode is active). | |
| Copycode Name | The name of the copycode (if copycode is active). | |
| Line | The line number in the Natural
source object, for example, 0120.
|
|
| Source | The Natural source line that
contains a statement definition, for example, MOVE #A TO
#B.
|
|
| Coverage% | The percentage of statement coverage of the line. | |
| Covered | The number of statements covered (executed) in the line. | |
| Missed | The number of missed (not executed) statements in the line. | |
| Total | The total number of all executable statements (object code instructions) in the line. | |
| Item Coverage | Indicates which statement items
(object code instructions) in the line have been covered or missed. Each
statement is represented by either 1 or 0, whereby
1 indicates a covered statement and 0 a missed
statement. For example: A value of x100 indicates that only the
first of three statements in the line is covered.
|
|
| Mark | Indicates the coverage state of
the line.
The Mark column can be used to visualize the coverage results in tools like Microsoft Excel. The possible Mark values are listed in Using a Microsoft Excel Template to Visualize Coverage Results. |
|
The following example assumes that the development has delivered a new
version of the TESTCOVN subprogram to the quality engineering.
After running the test programs, statement coverage of the subprogram shows the
following result (text format):
Statement Coverage
------------------
M Cov% CC-Lib   CC-Name  Line Source
*                        0010 * Test function Coverage
*                        0020 * Subprogram TESTCOVN
+                        0030 DEFINE DATA
+                        0040 PARAMETER
+                        0050 1 FUNC     (I2)  /* Function
+                        0060 1 RET-CODE (I4)  /* Return code
+                        0070 END-DEFINE
*                        0080 *
*                        0090 /* Return 0 by default
C 100%                   0100 RESET RET-CODE
*                        0110 *
C 100%                   0120 DECIDE ON FIRST VALUE OF FUNC
P  50%                   0130   VALUE 0
M   0%                   0140     PRINT 'Test function 0'
P  66%                   0150   VALUE 1
C 100%                   0160     PRINT 'Test function 1'
C 100%                   0170   VALUE 2
C 100%                   0180     PRINT 'Test function 2'
C 100%                   0190   VALUE 3
C 100%                   0200     PRINT 'Test function 3'
C 100%                   0210   VALUE 4
C 100%                   0220     PRINT 'Test function 4'
C 100%                   0230   VALUE 5
C 100%                   0240     PRINT 'Test function 5'
C 100%                   0250   VALUE 6
C 100%                   0260     PRINT 'Test function 6'
C 100%                   0270   VALUE 7
C 100%                   0280     PRINT 'Test function 7'
C 100%                   0290   VALUE 8
C 100%                   0300     PRINT 'Test function 8'
P  33%                   0310   VALUE 9
M   0%                   0320     PRINT 'New test function 9'
C 100%                   0330   NONE VALUE
M   0%                   0340     RET-CODE := 1 /* Unsupported function
+                        0350 END-DECIDE
*                        0360 *
C 100%                   0370 END
Explanations:
The Mark (M) column shows whether a line is covered
(C), missed (M) or partly covered
(P).
No test cases cover the functions Test function 0 and
New test function 9 (denoted with M and 0% coverage).
The NONE VALUE case is also not covered.
All other test cases are covered (denoted with C and
100% coverage).
A Natural VALUE statement corresponds to multiple
object code instructions. The coverage of 50% and 60%
for VALUE 0 and VALUE 1 statements indicates that
only a part of these object code instructions are covered.
This is because one of the generated object code instructions belongs
to the previous statement and the others to the current VALUE
statement for technical reasons.
As a consequence of this coverage analysis, the test cases have to be
adjusted so that Test function 0 and Test function 9
(and, perhaps, the error case with an unsupported function code) are also
covered.
Prerequisites: Microsoft Excel and Natural for Windows or Natural for UNIX.
If you want to analyze the coverage result with Microsoft Excel, you can use the Microsoft Excel template delivered with Natural for Windows and Natural for UNIX. Perform the following steps:
Perform the Profiler READ function and write the output
data in CSV (comma-separated values) format to Work File 7. For example:
FUNCTION=READ           /* Read Profiler Data
  RESOURCE-NAME='Test'  /* Resource name
  RESOURCE-LIB=PRFDATA  /* Resource library
  RESOURCE-TYPE=NCVF    /* Use resource type NCVF
  EVENT=ON              /* Print statement coverage
  PROGRAM=ON            /* Print program coverage
  STATISTICS=ON         /* Print statistics
  PRINT=ON              /* Write to standard output
  EXPORT=ON             /* Write to Work File 7
  FORMAT=COMMA          /* Export in CSV format
If your Microsoft Excel requires semicolons as separators, specify the following:
FORMAT=SEMICOLON /* Export in CSV format
Export the data of Work File 7 with any tool (such as FTP) as a CSV-formatted file to a Windows environment.
Open the CSV file with Microsoft Excel.
Rearrange the data so that each evaluation type (program, event, statistics) is on its own worksheet in the Microsoft Excel file.
Open the delivered template TESTCOV.XLSX with Microsoft
Excel. The template is contained in the RES (Resources)
subdirectory of the Natural SYSPRFLR system library.
For each worksheet, copy the format from the template to your Microsoft Excel:
Click on the upper left corner of the table in the template to mark all data in the table.
Click on the Microsoft Excel Copy format function.
Click on the upper left corner of the table in your worksheet to copy the format.
Now, all entries are formatted as in the template. The source lines are colored and marked as follows:
| Color | Mark | Description |
|---|---|---|
| Green | C |
All statements in the line are covered. |
| Yellow | P |
The statements in the line are partly covered. |
| Pink | M |
All statements in the line are missed. |
| Gray | * |
A comment or an empty line. |
| Red | E |
Error encountered.
For example, if the coverage analysis has collected a line number but the corresponding source line is not found. |
| None (white) | + |
All other lines such as continuation lines of a statement. |
The following example shows a worksheet extract of code coverage for
the TESTCOVP program with included TESTCOVC copycode
without the columns that contain the object name and library:
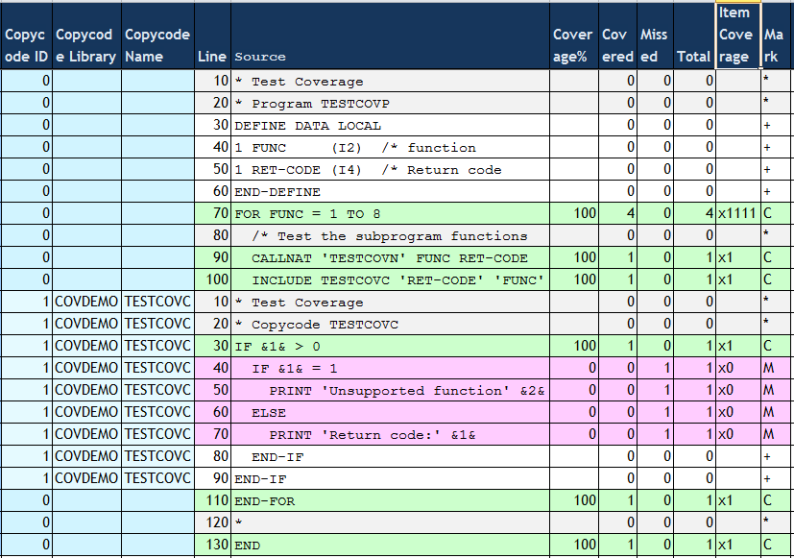
Explanations:
The source lines of the TESTCOVC copycode are included
in the source of the TESTCOVP program and placed right after the
corresponding INCLUDE statement.
The lines 40 through 70 (in pink) of the copycode contain missed statements which means they were not executed in the test run.
All other lines (in green) containing executable statements are covered.
A FOR statement corresponds to four object code
instructions. All four instructions are covered as indicated by
x1111 in the Item Coverage column.
If STATISTICS=ON is specified, the Profiler statistics are
listed.
If the data is exported in CSV (comma-separated values) format, the
properties and values of the Profiler statistics are added as separate columns
to the event or consolidation trace. If coverage data is exported in CSV
format, the statistics values are added in additional lines indicated by the
value Statistics in the Evaluation column.
- Example of Statistics
The following example shows an extract of the statistics of an NPRC resource file:
Explanations:
The
EDM-MONITOR.nprcresource was allocated on2015-07-27at10:36:19a.m. and has a size of565160bytes.The profiled application was running on the same day at
10:20:58a.m. for44.0seconds and started with the programMENUin the librarySYSEDMD.The profiled application generated a total of
895936Natural events. The data consolidation took15.6seconds and reduced the number of records to21624which corresponds to a consolidation factor of41.4.All statistics information provided is explained in the section Profiler Statistics.
You can visualize Profiler event data on an interactive MashZone dashboard by using the Natural Profiler MashApp.
The Profiler utility MASHZONE function reads the
consolidated data of an NPRC resource file and writes the data to Work File 7
in the format expected by the Natural Profiler MashApp. The
data of Work File 7 has to be exported by any tool (like FTP) as CSV
(comma-separated values) file to the Natural Profiler directory in the MashZone
environment before it can be accessed by the Natural Profiler
MashApp.
Syntax of MASHZONE:
FUNCTION=MASHZONE |
[RESOURCE-NAME=resource-name]
|
[RESOURCE-LIB=library-name]
|
Syntax Description:
| Keyword | Value | Description |
|---|---|---|
RESOURCE-NAME |
resource-name |
The name of the Natural Profiler resource
consolidated (NPRC) file to be exported for MashZone.
The extension Default: The name of the last created NPRC resource file in the library |
RESOURCE-LIB |
library-name |
The name of the Natural library that contains the
NPRC resource file you want to export.
Default: The name of the current library |
- READ
The following Profiler utility
READfunction is equivalent to theMASHZONEfunction and generates the same export data:FUNCTION=READ RESOURCE-NAME=resource-name RESOURCE-LIB=library-name RESOURCE-TYPE=NPRC EVENT=ON PROGRAM=OFF STATISTICS=ON PRINT=OFF EXPORT=ON FORMAT=SEMICOLON- CONSOLIDATE
The Natural Profiler MashApp can also process data exported with the Profiler utility
CONSOLIDATEfunction if you specify the following keywords:FUNCTION=CONSOLIDATE /* Consolidate Profiler data EXPORT=ON /* Write to Work File 7 FORMAT=SEMICOLON /* CVS format with semicolon separator ...
The following example reads the consolidated Profiler resource
Test.nprc in the library PRFDATA. The data is written
in CSV (comma-separated values) format to Work File 7 which can be
exported to
MashZone.
FUNCTION=MASHZONE       /* Export Profiler data for MashZone
  RESOURCE-NAME='Test'  /* Resource name
  RESOURCE-LIB=PRFDATA  /* Resource library
In general, Profiler resources are listed as NPRF, NPRC or NCVF files by using the Natural SYSMAIN utility, NaturalONE or Natural Studio. These tools also provide functions to copy, rename and delete resource files.
In addition, you can use Profiler utility functions to list and delete Profiler resource files.
This section covers the following topics:
The Profiler utility LIST function lists the Profiler
resource files of a given Natural library and the date and time when the
resource files were allocated.
Syntax of LIST:
FUNCTION=LIST |
[RESOURCE-LIB=library-name]
|
[RESOURCE-TYPE={NPRF|NPRC|NCVF}]
|
[PRINT={ON|OFF}]
|
[EXPORT={ON|OFF}]
|
[FORMAT={TEXT|COMMA|SEMICOLON}]
|
Syntax Description:
| Keyword for LIST | Value | Description |
|---|---|---|
RESOURCE-LIB |
library-name |
The name of the Natural library that contains
the Profiler resource files you want to list.
Default: The name of the current library |
RESOURCE-TYPE |
Specifies the type of resource files to be
listed: NPRF, NPRC or NCVF.
Default: All types are listed if no value is specified here. |
|
NPRF |
List NPRF (Natural Profiler Resource File) resource files only. | |
NPRC |
List NPRC (Natural Profiler Resource Consolidated) resource files only. | |
NCVF |
List NCVF (Natural code coverage file) resource files only. | |
PRINT |
Specifies whether the result is written to standard output. | |
ON |
Write to standard output. | |
OFF |
Do not write to standard output. | |
EXPORT |
Specifies whether the result is written to Natural Work File 7. | |
ON |
Write to Work File 7. | |
OFF |
Do not write to Work File 7. | |
FORMAT |
Specifies the format in which the exported data is written to Work File 7. | |
TEXT |
Write the data in free text format. | |
COMMA |
Write the data in CSV format with a comma
(,) used as a separator.
|
|
SEMICOLON |
Write the data in CSV format with a semicolon
(;) used as a separator.
|
- Example of LIST
The following example lists the NPRF Profiler resource files of library
PRFDATA. The list is written to standard output and to Work File 7 in text format.FUNCTION=LIST /* List Profiler resource files RESOURCE-LIB=PRFDATA /* Resource library RESOURCE-TYPE=NPRF /* List NPRF resource files PRINT=ON /* Write to standard output EXPORT=ON /* Write to Work File 7 FORMAT=TEXT /* Export in text formatOutput:
Natural Profiler Resources
--------------------------
Library: PRFDATA
Resource type: nprf

Count Date       Time     Name
    1 2015-06-15 14:32:18 Hello1.nprf
    2 2015-06-26 18:39:57 QDTest1.nprf
    3 2015-06-24 22:00:35 QETest1.nprf
    4 2015-06-30 14:32:42 Studio.nprf
    5 2015-07-02 15:02:32 Test.nprf

Number of nprf resources in library PRFDATA: 5
If you delete or replace a big resource file, it can happen that you receive the following error message:
Error - NAT3047 Maximum value for Adabas parameter NISNHQ
                           was exceeded.
In this case, you have two options:
Contact your database administrator to increase the Adabas parameter
NISNHQ.
Use the Profiler utility DELETE function to perform a
"dirty" delete of the resource. This function does not delete the
resource in one big step but in chunks (with an end of transaction after each
chunk). If the DELETE function fails by any reason, you need to
repeat it to get rid of inconsistent data.
Syntax of DELETE:
FUNCTION=DELETE |
[RESOURCE-NAME=resource-name]
|
[RESOURCE-TYPE={NPRF|NPRC|NCVF|NPRK|NONE}]
|
[RESOURCE-LIB=library-name]
|
Syntax Description:
| Keyword for DELETE | Value | Description |
|---|---|---|
RESOURCE-NAME |
resource-name |
The name of the Profiler resource file you
want to delete.
Possible extensions are Default: none If |
RESOURCE-TYPE |
The default resource type (extension) to be
deleted if no extension is specified with RESOURCE-NAME.
Default: |
|
NPRF |
The default resource type is NPRF with the
extension .nprf.
|
|
NPRC |
The default resource type is NPRC with the
extension .nprc.
|
|
NCVF |
The default resource type is NCVF with the
extension .ncvf.
|
|
NPRK |
The default resource type is NPRK with the
extension .nprk.
|
|
NONE |
The resource with the short name
resource-name is deleted.
|
|
RESOURCE-LIB |
library-name |
The name of the Natural library that contains
the resource you want to delete.
Default: The name of the current library |
FUNCTION=DELETE         /* Delete a Profiler resource file
  RESOURCE-NAME='Test'  /* Resource name
  RESOURCE-TYPE=NPRF    /* Resource type
  RESOURCE-LIB=PRFDATA  /* Resource library
The Profiler can read input data from a Natural text object. The syntax of the data in the Natural text object is the same as for the primary command input data set CMSYNIN (see Syntax and Keywords).
![]() To include Profiler input data from a Natural text object
To include Profiler input data from a Natural text object
Enter the following Profiler keywords:
INCLUDE-LIB=library-name
INCLUDE=object-name
The keyword syntax is explained in Profiler Utility Keywords.
The data in the Natural text object is added to the Profiler input data
in the line after the INCLUDE keyword. The Profiler input data can
contain multiple INCLUDE keywords, and the related Natural text
objects can also contain INCLUDE keywords. If a Natural text
object contains an END-PROFILER keyword, the Profiler utility
terminates and any remaining data in the Natural text object(s) is ignored.
The Natural system library SYSPRFLR supplies text object
whose names begin with X which can be used as Profiler input. The
individual Profiler functions they perform are described in the sources of
these objects.
We recommend that you do not modify any objects in the system library
SYSPRFLR because they can be overwritten or removed when a new
Natural version is installed. Copy the required object(s) to a user library
before you edit it.
The following example adds the contents of the Natural text object
MYPROF from the library MYLIB to the Profiler input
data:
INCLUDE-LIB=MYLIB
INCLUDE=MYPROF
The following example adds the contents of the Natural text object
XINIT from the library SYSPRFLR to the Profiler input
data. The object initializes and starts profiling without consolidation and
without statement event collection. Additionally, it terminates the Profiler
utility so that no further Profiler input is expected after the
INCLUDE keyword.
INCLUDE=XINIT
The Natural Profiler collects detailed information of each Natural event that occurs while a Natural application executes. This data can be viewed in the event trace.
The traces written for Natural code coverage are described in the section Tracing Natural Code Coverage.
The Profiler utility provides the following options to write a Profiler event trace:
Write the trace to standard output of the Profiler monitor session (MONPRINT data set) while the application is profiled.
Write the trace to standard output while the NPRF data is consolidated. In this case, the event trace shows the delta values of the elapsed time and the CPU time instead of event-specific data.
Write the trace when reading a Profiler NPRF resource file with the
Profiler utility READ function.
Note:
The event trace can also be listed in NaturalONE.
Enter the following subordinate keyword of the Profiler
utility INIT function:
TRACE-EVENT=ON
Enter the following subordinate keyword of the Profiler utility
CONSOLIDATE function:
TRACE-EVENT=ON
Enter the following subordinate keyword of the Profiler utility
READ function:
EVENT=ON
The Profiler event trace contains the following columns:
| Column | Description |
|---|---|
| Count | Event count |
| Time | Event time
Unit: hour:minute:second.microseconds |
| CPU-Time | Session CPU time
Unit: microseconds |
| Ev | Event type; see Events and Data Collected. |
| Lev | Program level |
| Library | Program library |
| Program | Program (Natural object) name |
| Line | Line number of program statement executed |
| CC-Lib | Copycode library (if copycode is active) |
| CC-Name | Copycode name (if copycode is active) |
| Statement | Natural statement currently executed. For technical reasons, there is no one-to-one relationship between a Natural source code statement and the corresponding object code in the cataloged object. Therefore, the statements listed in the Profiler event trace can differ from the statements in the source. |
| Local-Data | Event-specific data like the Adabas database ID
(DBID) and file number (FNR).
This data is only displayed for the Profiler utility
|
| Elapsed (ms) | Elapsed time spent processing the event.
Unit: milliseconds This data is only displayed for the Profiler utilityCONSOLIDATE function.
|
| CPU-Delta | CPU time spent processing the event.
Unit: milliseconds |
In the following example, the Profiler utility READ
function prints the event trace:
FUNCTION=READ               /* Read event data
  EVENT=ON                  /* Write event trace
The event trace is written to standard output:
Count Time              CPU-Time (ms) Ev Lev Library  Program  Line CC-Lib   CC-Name  Statement  Local-Data
    0 17:38:17.200951          42.324 MP 003 SYSPRFLR PRBINIT  8370                   Call       Monitor pause requested
    0 17:38:17.204508          43.471 MP 003 SYSPRFLR PRBSTART 1760                   Call       Start of block filter
   11 17:38:17.218379          48.874 DB 000                   0000                              00010/00032 S1
   12 17:38:17.218941          48.897 DA 000                   0000                              00010/00032 S1   Rsp: 0
   13 17:38:17.218944          48.910 PL 000                   0000                              Execute PRFDEMO/XPROF
   14 17:38:17.218945          48.916 PS 001 PRFDEMO  XPROF    0000                   PgmStart   00010/00032 Type: P
   15 17:38:17.218956          48.979 IB 001 PRFDEMO  XPROF    0300                   Input      Out: 133 In: 0
   16 17:38:17.219235          49.046 IA 001 PRFDEMO  XPROF    0300                   Input      Out: 133 In: 80
   17 17:38:17.219258          49.182 DB 001 PRFDEMO  XPROF    0370                   Callnat    00010/00032 S1
   18 17:38:17.220426          49.211 DA 001 PRFDEMO  XPROF    0370                   Callnat    00010/00032 S1   Rsp: 0
   19 17:38:17.220427          49.216 DB 001 PRFDEMO  XPROF    0370                   Callnat    00010/00032 S1
... |
When Natural code coverage is performed, the executed events can be viewed in the event trace.
When the Profiler reads a generated program (GP), the event trace also
shows the statements contained in the GP. The data which is written to the
Natural coverage resource file can be listed in the coverage trace. When the
resource is read with the Profiler utility READ function, the
coverage data can be traced with the internal data trace.
![]() To enable tracing for code coverage
To enable tracing for code coverage
Enable the event trace as described in To enable the event trace in the section Event Trace.
Enable the coverage trace by specifying the following subordinate
keyword of the Profiler utility COVERAGE function:
TRACE-COVERAGE=ON
Enable the internal trace by specifying the following subordinate
keyword of the Profiler utility READ function:
TRACE=9
The table below describes the properties listed in the traces and indicates with (X) for which type of trace the data is provided:
| Property | Event Trace | Coverage Trace | Internal Trace | Description |
|---|---|---|---|---|
| Count | X | X | X | The event count. |
| Ev | X | X | X | The event type. |
| Library | X | X | X | The name of the Natural library that contains the program/object. |
| Program/Object | X | X | X | The name of the Natural program/object. |
| Ty | - | X | X | The object type such as P for
program.
|
| CC-Lib | X | X | X | The name of the Natural library that contains the copycode (if copycode is active). |
| CC-Name | X | X | X | The name of the copycode. |
| Line | X | X | X | The source line number. |
| Statement | X | X | - | The Natural statement executed.
For technical reasons, there is no one-to-one relationship between a Natural source code statement and the corresponding object code in the cataloged object. Therefore, the statements listed in the Profiler event trace can differ from the statements in the source. For code coverage, the statement object code is not saved in the resource file. Therefore, it can only be listed during data collection. |
| GP-Offset | X | - | - | The offset in the GP.
It uniquely identifies the statement item at execution time. |
| Size | X | - | - | The size of the statement in the GP. |
| CC-ID | - | X | X | The copycode ID.
It uniquely identifies the copycode instance in the GP. The
program gets the copycode ID |
| Par-CC | - | X | X | For copycode only.
The parent copycode ID which is the copycode ID of the object/copycode that includes the current copycode. |
| INCL | - | X | - | For copycode only.
The line number of the |
| FirstS | - | X | X | The ID of the first statement of the object or copycode. |
| Stmts | - | X | X | The total number of executable statements in the
object whereby all INCLUDE statements are resolved.
|
| Item | X | X | X | The item ID of the statement.
It uniquely identifies the statement in the resource file. |
| Cover | X | X | X | The coverage flag (0 or
1) of the statement.
When the GP is read, all flags are initialized with
|
In the following example, the Profiler utility COVERAGE
function writes the coverage trace:
FUNCTION=COVERAGE           /* Initialize code coverage
  TRACE-COVERAGE=ON         /* Write coverage trace
The coverage trace is written to the standard output of the Profiler monitor session (MONPRINT data set):
                        Natural Coverage Trace
                        ----------------------
Count Ev Library  Program  Ty CC-Lib   CC-Name  Line Statement  CC-ID Par-CC INCL  FirstS  Stmts    Item Cover
    1 PI COVDEMO  TESTCOVN N                                        0      0 0000       1     44         1
    2 NS COVDEMO  TESTCOVN                      0130 Compute        0                                  4 0
    3 NS COVDEMO  TESTCOVN                      0140 Print          0                                  5 0
    4 NS COVDEMO  TESTCOVN                      0150 Goto           0                                  6 0
    5 NS COVDEMO  TESTCOVN                      0310 If             0                                 39 0
    6 NS COVDEMO  TESTCOVN                      0310 Compute        0                                 40 0
    7 NS COVDEMO  TESTCOVN                      0320 Print          0                                 41 0
    8 NS COVDEMO  TESTCOVN                      0340 Compute        0                                 43 0
    9 NS COVDEMO  TESTCOVN                      0100 Reset          0                                  1 1
   10 NS COVDEMO  TESTCOVN                      0120 Reset          0                                  2 1
   11 NS COVDEMO  TESTCOVN                      0130 If             0                                  3 1
   12 NS COVDEMO  TESTCOVN                      0150 If             0                                  7 1
...
The Profiler internal trace writes Profiler messages such as errors or warnings.
The internal trace can be activated for the following:
The Profiler monitor sessions (data collection). The data is written to the standard output of the monitor session.
The Profiler data processing functions. The data is written to standard output.
![]() To activate the internal trace for the Profiler trace
session or the data processing functions
To activate the internal trace for the Profiler trace
session or the data processing functions
Enter the following Profiler keyword:
TRACE=n
where n is the trace level (see Trace Levels).
Notes:
TRACE is not specified), Trace Level
2 (warnings) is used.
TRACE keyword
is specified. It is therefore recommended to specify the TRACE
keyword as soon as possible.
TRACE keyword with each execution.
![]() To activate the internal trace for the Profiler monitor session
To activate the internal trace for the Profiler monitor session
Enter the following subordinate keyword of the Profiler utility
INIT or COVERAGE function:
TRACE-MONITOR=n
where n is the trace level (see Trace Levels).
Note:
By default (if TRACE-MONITOR is not specified), Trace
Level 3 (statistics) is used.
The trace levels used by the Profiler trace and monitor sessions and by the Profiler data processing functions are listed in the following table. In general, a higher trace level also contains the information of the lower trace levels. For example, if you select Trace Level 3 (statistics), error messages and warnings are also logged.
We recommend that you use at least Trace Level 2 (warnings) so that error messages and warnings are logged. For the Profiler monitor session, Trace Level 3 (statistics) is a good choice. It prints the statistics of the Profiler run (see Profiler Statistics). Higher trace levels for the monitor session can be extremely verbose and the output can be mixed up with the event trace (if activated).
| Trace Level | Name | Description |
|---|---|---|
| 0 | No trace | Profiler internal trace is deactivated. |
| 1 | Error | Log error messages. |
| 2 | Warning | Log warnings. |
| 3 | Statistics | Trace session: Print the values
used for the Profiler utility INIT or COVERAGE
function.
Monitor session: Print the profiler statistics. Data consolidation: Print the profiler statistics including the consolidation statistics. |
| 4 | Function | Log messages for used
Profiler utility
keywords (FUNCTION, FILTER, etc.).
|
| 5 | Block | Print the statistics of each data block written to the Profiler resource file. |
| 6 | Details | Log detailed information. |
| 7 | Not used. | |
| 8 | Not used. | |
| 9 | Data | Trace the coverage resource data when reading an NCVF coverage resource file. |
| 10 | Internal | Internal usage. |
In the following example, the Profiler internal trace is set to
4 (function) for the trace session:
* Set Profiler internal trace
TRACE=4                     /* Trace level
Output of the Profiler trace session for Trace Level 4:
PRBMAIN : Profiler trace level: 4 PRBMAIN : Profiler On-Error: Terminate *************************************************************************** * 15:45:14 ***** NATURAL PROFILER UTILITY ***** 2014-12-17 * User SAGPRFD1 - Function INIT - PRBINIT * * Keyword Value * -------------------- ---------------------------------------------------- * Resource ON * Resource-Lib SAGPROF * Resource-Name Test01.nprf * Replace Y * Wait-Full 60 * Wait-Empty 60 * Sampling OFF * Consolidate OFF * Trace-Monitor 5 * Trace-Event OFF * Trace-Consolidate OFF * -------------------- ---------------------------------------------------- *************************************************************************** PRBINIT : Profiler INIT function - Start monitor session. PRBINIT : Profiler INIT function - Monitor session started. Time: 1.0 sec. PRBINIT : Set trace session Id ...: 0000000000000001 PRBINIT : Set monitor session Id .: 0000000100000000 PRBINIT : Trace session successfully initialized. PRBFEVEN: Event filter: SI ST DB DA PL PS PT PR IB IA E CB CA U RS RI RO NS PRBSTART: Profiling started. PRBMAIN : Profiler - End of input. *************************************************************************** ... Output of the application ... |
In addition to event data, the Profiler collects statistical data which is written to the Profiler resource file.
The Profiler utility provides the following options to write and view Profiler statistics:
Write the statistics to the standard output of the Profiler monitor session (MONPRINT data set) while the application is profiled or code coverage is performed.
Write the statistics to standard output while the data is consolidated.
Write the statistics when reading a Profiler resource file with the
Profiler utility READ function.
View the statistics with the Natural Profiler MashApp.
To write Profiler statistics, perform one of the following steps
Enter the following subordinate keyword of the Profiler utility
INIT or COVERAGE function:
TRACE-MONITOR=3
or a higher trace level (see Trace Levels). Trace Level 3 is also the default level for the Profiler monitor session.
Enter the following keyword before you start the Profiler utility
CONSOLIDATE function:
TRACE=3
or a higher trace level (see Trace Levels).
Enter the following subordinate keyword of the Profiler utility
READ function:
STATISTICS=ON
The Profiler statistical data is displayed in categories combining properties of a similar type. The following categories are available:
Note:
The properties listed in the following section are the properties
provided by the Profiler in all environments. The Profiler Statistics contains
only the properties that are relevant for the current run. Therefore, not all
of the properties listed in the section are displayed in every
case.
Display environment and Natural Profiler related information.
| Property | Unit | Description |
|---|---|---|
| Machine class | The name of the machine class on which the Natural application is running. | |
| Environment | The environment in which the Natural application is running,
such as NaturalONE, Batch or
RPC.
|
|
| Codepage | The code page used while the Natural application was monitored. | |
| User | The ID of the user running the application (value of
*USER). For a batch job, it can contain the name
of the job.
|
|
| Profiler version | The internal version of the Profiler.
NaturalONE environment: The version of the Profiler on the server. |
|
| Profiler revision | vvrr.xxx | The Profiler revision is build up by the Natural version and the last Profiler correction number. |
| Profiler revision date | yyyy-mm-dd hh:ii | The date and time when the Profiler revision was created. |
| Profiler client version | NaturalONE environment: The version of the Profiler client. | |
| Profiler trace library | NaturalONE environment: The name of the Natural library containing the Profiler internal trace and the Profiler event trace. | |
| Profiler trace level | The level of the Profiler internal trace. | |
| Profiler trace member | NaturalONE environment: The name of the Natural text object containing the Profiler internal trace. | |
| Profiler event trace | Indicates whether the Profiler event trace was activated
(ON/OFF).
|
|
| Profiler event trace member | NaturalONE environment: The name of the Natural text object containing the Profiler event trace. | |
| Utility trace level | NaturalONE environment: The Natural utilities trace level. |
Display Profiler resource file related information.
| Property | Unit | Description |
|---|---|---|
| Resource name | The name of the Natural Profiler resource file. | |
| Resource type | The type of the Natural Profiler resource file: Natural Profiler resource file (NPRF), Natural Profiler resource consolidated (NPRC) or Natural code coverage file (NCVF). | |
| Resource short name | Mainframe: The short name of the Natural Profiler resource file. | |
| Resource library | The name of the Natural library containing the Natural Profiler resource file. | |
| Resource DBID | The database ID of the Natural library containing the Natural Profiler resource file. | |
| Resource FNR | The file number of the Natural library containing the Natural Profiler resource file. | |
| Resource allocation date | yyyy-mm-dd hh:ii:ss.t | The date and time when the Natural Profiler resource file was allocated. |
| Resource size | bytes | The size of the Natural Profiler resource file. It comprises the resource headers, the event data and the properties. The resource size is calculated regardless whether the resource is allocated or not. |
| Resource block size | bytes | The maximum size of a resource block. A resource block consists of a resource block header and a data block. |
| Resource version | The version of the Natural Profiler resource layout. |
Display statistics of the Profiler monitor session.
| Property | Unit | Description |
|---|---|---|
| Monitor start time | yyyy-mm-dd hh:ii:ss.t | The date and time when the monitor session started. |
| Monitor end time | yyyy-mm-dd hh:ii:ss.t | The date and time when the monitor session ended. |
| Monitor elapsed time | sec | The total elapsed time consumed by the monitor session. |
Display statistics of the Profiler trace session. The Profiler trace session includes also the application execution.
| Property | Unit | Description |
|---|---|---|
| First library | The first library monitored. The libraries
SYSTEM, SYSLIB* and SYSPRF* are
ignored.
|
|
| First program | The first program monitored. | |
| Highest level | Highest level number of the Natural objects monitored. | |
| Trace start time | hh:ii:ss.microsec | The start time of the tracing. With NaturalONE this is the time
of the SI (session initialization) event. In batch, the session is
already initialized when the monitoring starts. Therefore, the start time is
the time of the first event (usually a Monitor Pause event).
|
| Trace end time | hh:ii:ss.microsec | The end time of the tracing. This is in general the time of the
ST (session termination) event.
|
| Trace elapsed time | sec | The elapsed time consumed by the trace session from the start time to the end time. |
| Application CPU time | ms | The total CPU time consumed by the application. |
| Monitor CPU time | ms | The total CPU time consumed by the Natural data collector. This time is not measured by the Natural UNIX or Windows server. |
| Total CPU time | ms | The total CPU time consumed by the trace session. It is the sum of the application CPU time and the monitor CPU time. |
| Sampling interval | microsec | The sampling interval time (CPU time in microseconds). A value
of zero (0) means that no sampling was active.
|
| Data pool empty | The number of Profiler read requests which found the Profiler data pool empty (and a session active). | |
| Data pool empty after full | The number of Profiler read requests which found the Profiler data pool empty although it was full before. If this counter is greater than 0, the Profiler data pool is too small which leads to a poor performance. | |
| Data pool overflow | The number of Profiler data pool overflows (with data lost). Data pool overflows should no longer happen. This property is only maintained for backward compatibility with previous versions of Natural. | |
| No session active | The number of read requests which found the Profiler data pool empty and no trace session active. This can only happen for Profiler read requests submitted before the session initialization or after the session termination. |
Display statistics of the data processing, compression and transfer.
| Property | Unit | Description |
|---|---|---|
| Number of events | The total number of events. | |
| Highest event number | The highest event number as given by the Natural data collector. Note that the Natural data collector counts only non-statement events when called from NaturalONE. In batch it depends on the statement filter whether statement events are counted or not. | |
| Number of data blocks | The number of event data blocks send to NaturalONE or written to the resource. | |
| Utility buffer size | bytes | The size of the utility buffer used for the data transfer from the server to NaturalONE. In general, the buffer contains the header information and function-specific data. |
| Data block size | bytes | The maximum amount of event data which can be transferred from the server to NaturalONE in one call. The same data block size is used for storing the event data in the resource file. |
| RDC data length | bytes | The total size of the data received from the Natural Data Collector. |
| Uncompressed data length | bytes | The total size of the Profiler data in uncompressed format. |
| Compressed data length | bytes | The total size of the compressed data as send to NaturalONE or written to the Profiler resource file. |
| Identical bytes trimmed left | The number of identical bytes trimmed left at the forward data compression. | |
| Blanks trimmed right | The number of blanks trimmed right at the backward data compression. | |
| Compression header length | bytes | The total size of the compression headers saved with each compressed event record. |
| Compression rate | percent | The percentage of the data reduction by the compression. The higher the compression rate, the less data has to be transferred or saved. The formula of the compression rate is described below. |
| Events/block | The average number of events contained in one event data block. | |
| Bytes/event | The average length in bytes of a compressed event data record. This property is not available for consolidated or coverage data. |
The compression rate is calculated by the following formula:
CompressionRate := 100 × |
|
Display statistics of the event types.
| Property | Description |
|---|---|
| Unknown event | The number of unknown events. |
| Session initialization | The number of Session Initialization events. |
| Session termination | The number of Session Termination events. |
| Program load | The number of Program Load events. |
| Program start | The number of Program Start events. |
| Program termination | The number of Program Termination events. |
| Program resume | The number of Program Resume events. |
| Program information | The number of Program Information events. |
| Before database call | The number of Before Database Call events. |
| After database call | The number of After Database Call events. |
| Before terminal I/O | The number of Before Terminal I/O events. |
| After terminal I/O | The number of After Terminal I/O events. |
| Before external program call | The number of Before External Program Call events. |
| After external program call | The number of After External Program Call events. |
| Runtime error | The number of Runtime Error events. |
| Natural statement | The number of Natural Statement events. For technical reasons, multiple Natural statements can be merged into one statement event and conversely, one Natural statement can cover multiple statement events. |
| Outbound RPC message | The number of Outbound RPC Message events. |
| Inbound RPC message | The number of Inbound RPC Message events. |
| Start RPC request execution | The number of Start of RPC Request Execution events. |
| RPC Wait for Client | The number of RPC Wait for Client events. |
| User trace call | The number of User-Defined Events. |
| Monitor pause | The number of Monitor Pause events. |
| Monitor filter | The number of monitor filter events. Filter events are not recorded. |
Display statistics of the types of Monitor Pause events.
| Property | Description |
|---|---|
| Pause - unknown type | The number of Monitor Pause events with unknown pause type. |
| Pause - requested | The number of requested Monitor Pause events. |
| Pause - start of block filter | The number of Monitor Pause events caused by a start of a block filter (library, program, line, FNAT, event count or time filter). |
| Pause - data pool full | The number of Monitor Pause events caused by a data pool full situation. |
| Pause - data pool overflow | The number of Monitor Pause events caused by a data pool overflow situation. |
Display statistics of the data consolidation.
| Property | Unit | Description |
|---|---|---|
| Consolidation | Indicates whether the Profiler data is
consolidated (ON/OFF). The consolidation aggregates
similar events into one consolidation record.
|
|
| Consolidation records | The total number of consolidation records. In general, a consolidation record comprises multiple events. | |
| Consolidation elapsed time | sec | The elapsed time in seconds required for the
data consolidation with the Profiler utility CONSOLIDATE function.
This value is not provided when the consolidation is
performed during data collection (Profiler utility |
| Consolidation factor | The average number of events combined into one
consolidation record. The higher the consolidation factor, the better the
consolidation.
ConsolidationFactor := NumberOfEvents / ConsolidationRecords |
|
| Consolidation records/block | The average number of consolidation records contained in one data block. | |
| Bytes/consolidation record | The average length in bytes of a compressed consolidation record. | |
| Consolidate I/O time | Indicates whether I/O and Natural RPC client time are included in the consolidated data. |
Display statistics of Natural code coverage.
Note:
Natural code coverage statistics are collected on the mainframe
only.
| Property | Description |
|---|---|
| Coverage | Indicates whether Natural code coverage is
performed (ON/OFF).
|
| Missed statements recorded | Indicates whether missed statements are recorded
(ON/OFF).
|
| Coverage records | The total number of coverage records. These are program information and Natural statement records. |
| Program information records | The number of program information records written to the resource file. Each program information record contains program and copycode related information. |
| Coverage records/block | The average number of coverage records contained in one data block. |
| Bytes/coverage record | The average length in bytes of a compressed coverage record. |
| Programs covered | The number of covered programs. |
| Statement coverage | The percentage of statements of all accessed programs that have been covered by the application. |
| Statements covered | The number of covered (executed) statements. |
| Statements total | The total number of executable statements of all programs accessed. |