This document provides general information on profiling Natural applications.
A profiler is a tool for dynamic program analysis. It measures the frequency and duration of instructions to simplify program optimization.
The Natural Profiler is used to profile Natural applications. It collects profiling data whenever a defined Natural event occurs, for example, when a program starts or before a database is called. The Natural Profiler visualizes the recorded event data as an event trace and the calling structure of the executed Natural objects as a program trace. The performance evaluation provided by the Natural Profiler shows the time consumption and hit count of the executed objects, Natural statements and program lines.
You can view Natural Profiler event data in the Profiler utility output or export the data in text or table format. You can visualize Natural Profiler performance analyses in NaturalONE (Software AG’s Eclipse-based development environment) or with the Natural Profiler Rich GUI (a Natural for Ajax application).
A Natural Profiler analysis serves as the basis for performance optimization of a Natural application. The Natural Profiler provides you with a very fast overview about the time-consuming parts of a Natural application. No code modification is required, and moreover, just basic knowledge of the application is sufficient.
This section briefly describes the steps required for profiling Natural batch applications and viewing the results. The instructions provided here may serve as a guideline when starting to use the Natural Profiler. Detailed information regarding the steps is provided in the remainder of this chapter.
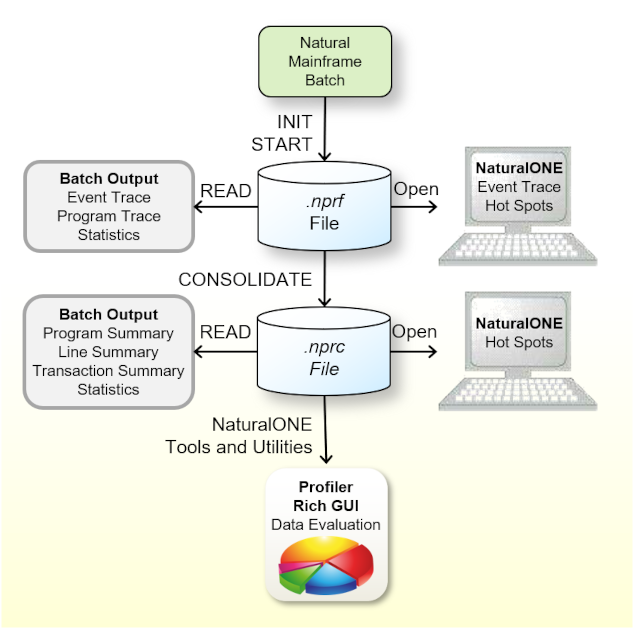
The steps to take depend on the evaluation you want to perform for your application as illustrated in the following graphic:
Check that the prerequisites are met.
Add the Profiler utility INIT, FILTER and
START functions to the Natural batch job to start the event data
collection. In the following example for z/OS, the Natural program XPROF in library
PRFDEMO is profiled:
//CMSYNIN  DD  *
PROFILER
FUNCTION=INIT                /* Initialize profiling
  RESOURCE-NAME='ResNam',REPLACE=YES  /* Resource name
  RESOURCE-LIB=RESLIB        /* Resource library
FILTER=EVENT                 /* Set event filter
  EVENT=ALL                  /* All events
  STATEMENT=ON               /* Collect statements
FUNCTION=START               /* Start data collection
END-PROFILER                 /* End Profiler input
LOGON PRFDEMO
XPROF
10000
FIN
In the example above, the Profiler event data is written to a resource file
with the name ResNam.nprf in the library RESLIB. See also
Initializing
Profiling and Starting and Pausing Data Collection.
Open the NPRF resource in NaturalONE to view the hot spots and the event trace.
Submit a Natural batch job with the Profiler utility READ function to
print an event trace, a program trace and the Profiler statistics. Example:
FUNCTION=READ           /* Read Profiler data
  RESOURCE-LIB=RESLIB   /* Resource library
  RESOURCE-TYPE=NPRF    /* Use resource type NPRF
  EVENT=ON              /* Print event trace
  PROGRAM=ON            /* Print program trace
  STATISTICS=ON         /* Print statistics
See also Profiler Utility READ Function. This section also describes how to generate a transaction summary.
Consolidate (aggregate) the event data from the Profiler Rich GUI or submit a Natural
batch job with the Profiler utility CONSOLIDATE function. Example:
FUNCTION=CONSOLIDATE    /* Consolidate Profiler data
  RESOURCE-LIB=RESLIB   /* Resource library
  REPLACE=YES           /* Replace resource
The consolidated Profiler event data is written to the resource
ResNam.nprc in the library RESLIB. See Consolidating Event
Data.
Open the NPRC resource in NaturalONE to view the hot spots.
Open the NPRC resource with the Profiler Rich GUI Data Evaluation or Program Analysis to visualize the Profiler data on a graphical, interactive browser interface.
Submit a Natural batch job with the Profiler utility READ function to
generate a program summary, a line summary and the Profiler statistics. Example:
FUNCTION=READ           /* Read Profiler Data
  RESOURCE-LIB=RESLIB   /* Resource library
  RESOURCE-TYPE=NPRC    /* Use resource type NPRC
  PROGRAM=ON            /* Print program summary
  LINE=ON               /* Print line summary
  STATISTICS=ON         /* Print statistics
See also Profiler Utility READ Function. This section also describes how to generate a transaction summary.
Notes:
READ or
CONSOLIDATE function of the Profiler utility, the last created NPRF or
NPRC resource in the library is used.
You can profile Natural applications on Linux, Windows, and mainframe platforms. How to profile a Natural application depends on the platform and the application processing mode used:
Mainframe interactive applications are profiled with the NaturalONE Profiler or the Profiler utility in online mode.
Mainframe interactive applications executed remotely from Natural Studio or RPC are profiled with the Profiler utility in batch mode.
Mainframe batch applications are profiled with the Profiler utility in batch mode.
Linux and Windows interactive applications are profiled with the NaturalONE Profiler or the Natural Profiler for Linux and Windows, respectively.
Linux and Windows batch applications are profiled with the Natural Profiler for Linux and Windows, respectively.
This section summarizes the key features of the Natural profiling tools:
Profiles interactive Natural applications from Linux, Windows, or mainframe platforms in an Eclipse-based development environment.
Reads and analyzes Profiler resource files containing event data collected by the mainframe Profiler utility in batch mode or by the Natural Profiler for Linux and Windows.
Provides features for big data handling:
Event filter,
Sampling technique,
Data consolidation.
Performance analyses of programs, statements and program lines:
CPU time,
Elapsed time,
Hit count.
Displays an event trace.
Provides direct navigation from a profiled program line to the corresponding source code.
Saves and reloads the Profiler data as an XML-formatted file.
Profiles interactive or Natural batch applications from Linux or Windows platforms.
Provides features for big data handling:
Event filter,
Sampling technique,
Data consolidation.
Saves the Profiler data as a Profiler resource file.
- Online Mode (Mainframes)
Profiles interactive Natural applications from mainframe platforms.
Provides an event filter.
Displays an event trace.
Saves the Profiler data in a table format.
Saves the Profiler data as a Profiler resource file.
Note
The amount of data collected by the Profiler utility in online mode is restricted by the relatively small size of the Natural Data Collector buffer which works in a wrap-around mode. Moreover, when running under CICS or Com-plete, the CPU time is not provided. In general, we recommend that you use the NaturalONE Profiler for profiling interactive Natural mainframe applications because the NaturalONE Profiler has no size restrictions and supports CPU performance analyses.- Batch Mode (Mainframes)
Profiles Natural batch and Natural RPC applications from mainframe platforms.
Profiles mainframe interactive applications executed remotely from Natural Studio.
Provides features for big data handling:
Event, program, count and time filters,
Sampling technique,
Data consolidation.
Saves Profiler data as a Profiler resource file.
Reads and analyzes Profiler resource files.
Prints program and event traces.
Analyzes program performance.
Evaluates transaction response times.
Collects and displays Profiler properties and statistics.
Provides a function to delete a Natural Profiler resource file.
- Batch Mode (Linux and Windows)
Reads and analyzes Profiler resource files.
Provides features for big data handling:
Data consolidation.
Saves consolidated Profiler data as a Profiler resource file.
Prints program and event traces.
Analyses program performance.
Displays Profiler properties and statistics.
Lists the Profiler resources of a given library.
Displays Profiler properties and statistics.
Provides a function to consolidate Profiler data.
Provides a function to delete a Natural Profiler resource file.
Visualizes Profiler data on a graphical, interactive browser interface.
Analyzes application performance with selection criteria such as library, program, program line or user for various KPIs:
CPU time,
Elapsed time,
Adabas command time,
Hit counts like database calls or runtime errors.
Combines the program source with the Profiler data for program analysis.
The evaluation criteria provided by the Natural profiling tools are summarized in the following table:
| Evaluation | Profiling Tool | Description |
|---|---|---|
| Program Summary | Profiler utility (batch) | Shows the CPU time spent for each Natural object that executed
and the Natural events that occurred in an object.
See also Example of a Program Summary. |
| Line Summary | Profiler utility (batch) | Shows the CPU and elapsed time spent during Natural program
execution for each individual source line and the number of Natural events that
occurred in the line.
See also Example of a Line Summary. |
| Transaction Summary | Profiler utility (batch) | Shows the response time spent for each individual transaction
and the number of Natural events that occurred during transaction execution.
For more information, see Transaction Summary. See also Example of a Transaction Summary. |
| Hot Spots | NaturalONE Profiler | Shows the CPU and elapsed time used by Natural objects,
statements and program lines and how often an object or statement executed.
From a profiled program line you can directly navigate to the corresponding source code line. See also the appropriate description of hot spots in Using the Natural Profiler in the NaturalONE documentation. |
| Data Evaluation | Natural Profiler Rich GUI | Visualizes the Profiler data on an interactive rich GUI
interface. You can evaluate the distribution of the CPU and elapsed time, the
Adabas command time or various hit counts and select criteria for the
distribution.
See also the example of a data evaluation in the Natural Profiler Rich GUI section. |
| Program Analysis | Natural Profiler Rich GUI | Combines the source of monitored programs with the Profiler
data whereby the source is colored according to the value of the selected KPI.
See also the example of a program analysis in the Natural Profiler Rich GUI section. |
| Program Trace | Profiler utility (batch) | Shows the program flow of the profiled application in the call
hierarchy and the number of events that occurred.
See also Example of a Program Trace. |
| Event Trace |
NaturalONE Profiler, |
Lists the recorded event data in chronological order.
See also Example of an Event Trace, Example of List Trace Records, and the appropriate description in Using the Natural Profiler in the NaturalONE documentation. |
|
Natural Profiler Rich GUI, |
Lists Profiler properties such as the Profiler revision, and
statistics of the monitored application that show, for example, the total CPU and
elapsed time.
See also the example with properties and statistics in the Natural Profiler Rich GUI section, and Profiler Statistics(batch). |
