Decide which data you want to see
The data table is the default view when you first open the data workbench. All objects that you have permissions for will be displayed in the data workbench the first time you go to it.
The first thing you should do is structure the data workbench by deciding which information you want to display. The data table is where you can see all of your data, specify the columns of information you want to display, and define filters to limit the dataset to the objects you are most interested in. Your settings will be saved and displayed the next time you return to the data workbench. Click Structure > Set to Default to return to the default settings.
If the dataset is large or you need to work with a subset of data, you can set filters to reduce the number of objects to only those that are relevant for your current information needs. The column structure and filter settings are persistant and will be displayed when you return to the data workbench, but you can change them at anytime.

|
The data displayed in the data table - whether it is the total dataset or a subset of data - is the dataset used for all visualizations in the Visualize menu. This enables you to create an ad-hoc data source that is relevant for a visualization like a bar chart, Gantt chart, Kanban board, etc.
Click Visualize Data > Data Table to return to the data table at any time. |
- Ensure that you are working in the data table. If not, click Visualize Data > Data Table.
-
Add the columns of data to display. Each column represents either standard attributes, indicator types, roles, and generic attributes. Click Structure Data and select the relevant Add/Remove option to add standard attributes, indicators, roles, and generic attributes. You can add or remove columns at any point.
- The indicator icon and semantic value is displayed for indicators.
- The name of the person or organization along with the respective person or organization icon is displayed for roles.

To focus only on the quality of your data, display the attributes Name, Data Quality Score, Data Quality Severity, and Data Quality Calculation Date. The Data Quality Severity displays the symbols no error
 , hint
  , warning
  , and error
  .
.To return to the default set of columns in the data workbench, select Structure Data > Reset to Default. The reset will restore the default setting except for filters defined on individual columns.
- Reaarange the order of the columns. You can reorder columns, filter data in a column, and define a filter based on queries of the dataset. Click Structure Data > Reorder Columns and click a column in the editor and use the up and down arrows to change the sort order.
- Reorder the data in the columns: Click the column header to switch the order of the data between ascending and descending order.
-
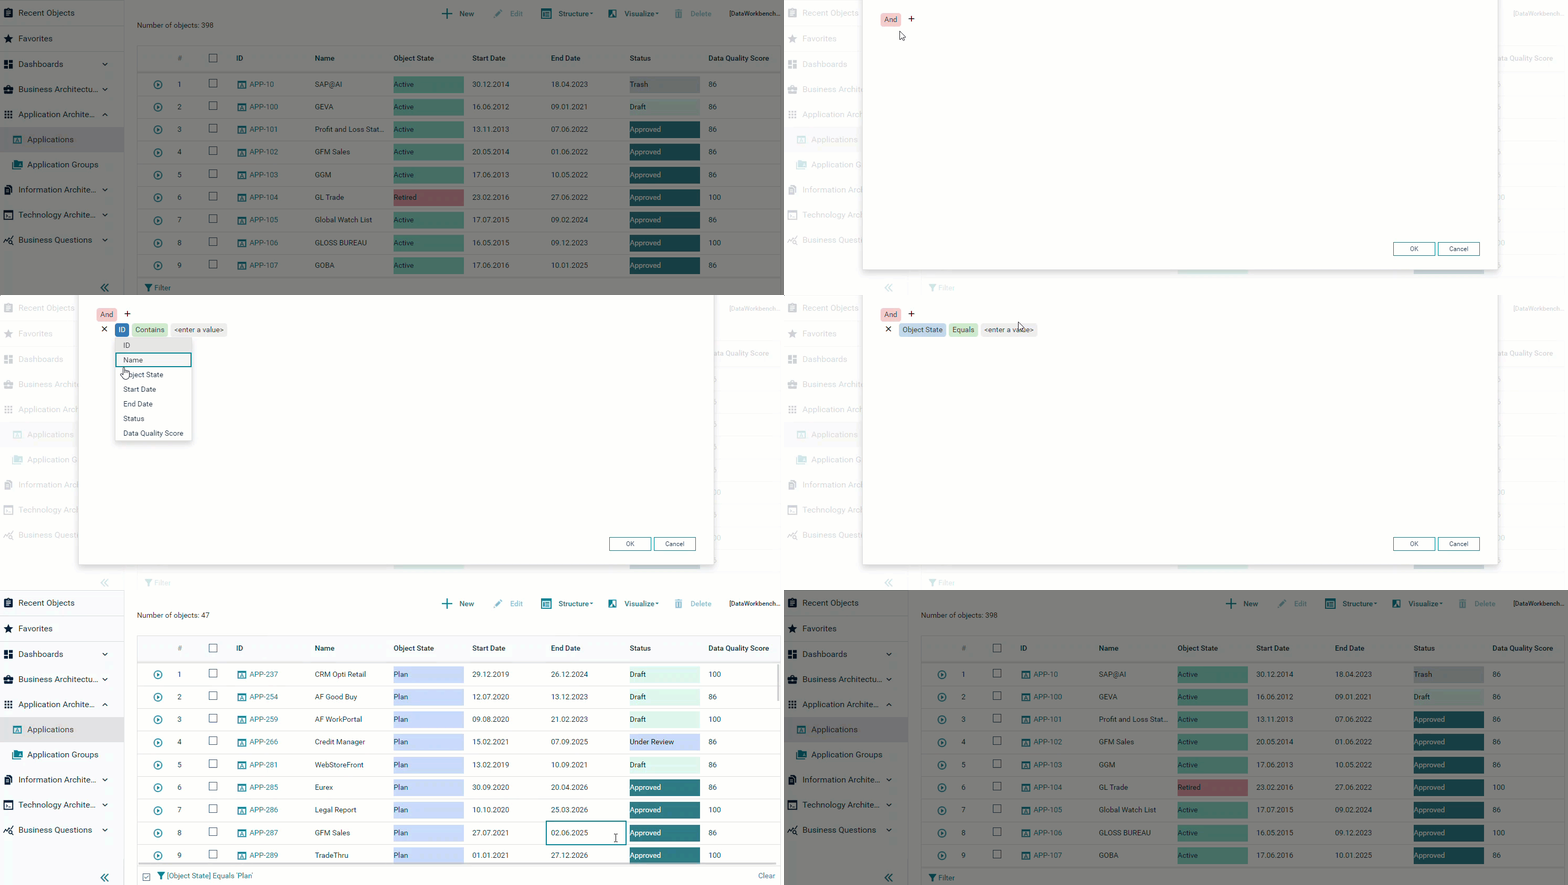
Filter the data the dataset: You can define filters on individual columns or you can define filters via queries using operators. Any filters that are set are displayed at the bottom left of the data workbench next to the
 button. You can clear all filters by clicking Clear at the bottom right:
 - Filter the data in columns: Click the
 icon at the top of a column. Set a checkmark for all values that you want to display. The button at the bottom will show all values that have been hidden via the filter settings. Click the link to open the Filter Builder to view and modify the operators of the query.
 - Filter the data using operators: Click the
 button at the bottom left of the data workbench to open the Filter Builder:

- Click the And button and select a search operator.
- Click Condition. You will see the default query IDContains<enter a value<.
- Click ID and select the attribute to query.
- Click Contains and select the search operator.
- Click <enter a value< and enter the value to query in the text field.
- Click OK to save the query. The query is displayed at the bottom left of the data workbench next to the
 button. Click the query to open the Filter Builder to modify it or click the Clear button to remove the filter setting.
- Filter the data in columns: Click the