How Do I Generate Thread Dump?
Thread dumps are vital artifacts to diagnose CPU spikes, deadlocks, memory problems, unresponsive applications, poor response times, and other system problems. Thread dump is used to analyze thread contention issues and it provides information on the exact status of each thread and information about the call stack of each thread. There are various platforms to generate a thread dump. This section explains few platforms from where you can take a thread dump. You can choose any platform according to your requirement.
Prerequisites:

Java 7 version and above is considered for generating dumps.
To check the Process ID (PID) of the API Gateway JAVA application:
Linux: Run the following command ps –ef | grep java
Windows: JAVA PID is available in the Task Manager
Generate Thread Dump using jstack
jstack is an effective command line tool to capture thread dumps. The jstack tool is located in the JRE or JDK_HOME\bin folder.
Run the following command to generate thread dump:
jstack -l pid > file_path
where:
pid. Process Id of the application, whose thread dump should be generated.
file_path. File path, where the thread dump has to be generated.
Example:
jstack -l 37320 > /opt/tmp/threadDump.txt
37320 is the PID and the opt/tmp/threadDump.txt is the location where the thread dump of the process is generated.
Note:
The following shell script generates the thread dumps automatically multiple times:
i=1
while [ $i -le 5 ]
do
echo jstack -l <PID> > ThreadDump$i
sleep 10
i=`expr $i + 1`
done
Generate Thread Dump using jVisualVM
Java VisualVM is a graphical user interface tool that provides detailed information about the applications while they are running on a specified Java Virtual Machine (JVM). jVisualVM is located in JDK_HOME\bin\jvisualvm.exe
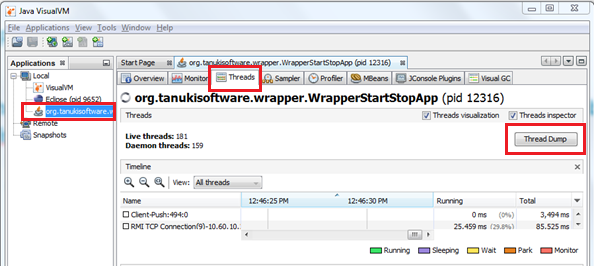
1. Launch the jVisualVM.
2. Select your java application from the list in the left pane.
The left pane of the window lists all the java applications that are running on your system.
3. Click on the Threads tab in the right pane.
4. Click Thread Dump button.
The thread dump is generated.
Example:
Note:
This tool also has the capability to generate thread dumps from the java processes that are running in remote host as well. To connect to the jVisualVM, the java process (remote process) must be started with the JMX port using the following command:
java -Dcom.sun.management.jmxremote.port=3333 \
-Dcom.sun.management.jmxremote.ssl=false \
-Dcom.sun.management.jmxremote.authenticate=false \
YourJavaApp
Generate Thread Dump using JCMD
The JCMD tool is located in theJRE or JDK_HOME\bin folder. To generate thread dump using JCMD:
Run the following JCMD command to generate thread dump:
jcmd <pid> Thread.print > file_path
where:
pid. Process Id of the application, whose thread dump should be generated.
file_path. File path, where the thread dump is generated.
Example:
jcmd 37320 Thread.print > /opt/tmp/threadDump.txt
37320 is the PID and the opt/tmp/threadDump.txt is the location where the thread dump of the process is generated.