Monitoring API Gateway
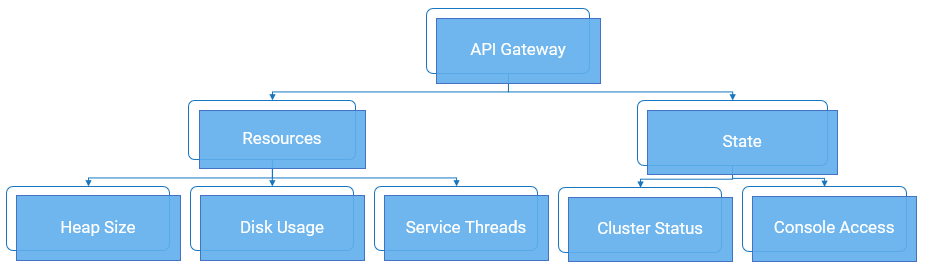
As part of application monitoring, you can monitor the state, that is the cluster status and console access of API Gateway along with the resources.
How do I monitor the health of API Gateway?
Prerequisites:

You must have a valid
API Gateway user credential for using the Readiness Probe, Runtime Service Health Probe, and Administration Service Health Probe.
All the node level probes must be setup to target the local instance, typically, localhost.
Software AG recommends to set up a dedicated port for monitoring with an appropriate private thread pool.
Readiness Probe at Node-Level
To monitor the readiness of API Gateway, that is to check if the traffic-serving port of a particular API Gateway node is ready to accept requests, use the following REST endpoint:
GET /rest/apigateway/health
The following table shows the response code and the description.
Response | Description |
200 OK | Readiness check is successful. Readiness probe continues to reply OK if API Gateway remains in an operational state to serve the requests. |
500 Internal server error | Readiness check failed and denotes a problem. |
timeout or no response as the request did not reach the probe | Several factors can contribute to the delay when the Readiness Probe initiates, which may result in the timeout errors. To know the reasons for timeout errors, see
Causes for timeout errors for more information. |
Note:
As this is a Readiness Probe and only the response status code is essential, by design, JSON payload is not returned in the response for both success and failure scenarios.
Runtime Service Health Probe at Node-Level
To monitor the runtime service health of of API Gateway, that is to check the overall cluster health and to identify if the components of a particular API Gateway node are in an operational state, use the following REST endpoint:
GET /rest/apigateway/health/engine
The following table shows the response code and the description.
Response | Description |
200 OK | Runtime service health check is successful. |
500 Internal server error | Runtime service health check failed and denotes a problem. The response JSON indicates the problem. |
timeout or no response as the request did not reach the probe | Several factors can contribute to the delay when the Runtime Service Health Probe initiates, which may result in the timeout errors. To know the reasons for timeout errors, see
Causes for timeout errors for more information. |
The response JSON of each health check request displays a status field in the response.
The overall status of API Gateway node can be green ,yellow, or red.
Status | Description |
green | Indicates that the cluster within the node is in a healthy state. |
yellow | Indicates that API Gateway does not have adequate resources to run. |
red | Indicates the cluster failure in the node and an outage. |
The overall status of API Gateway node is assessed based on the API Data Store status, API Gateway resource status, and the Terracotta server status.
API Data Store status
Status | Description |
green | Indicates that API Data Store is in a healthy state. When the status of API Data Store signals green or yellow, the overall status of API Gateway is green. |
red | Indicates that API Data Store is not in a healthy state. When the status of API Data Store signals red, the overall status of API Gateway is red. |
yellow | Indicates a node failure in the cluster. However, the cluster is still functioning and operational. |
API Gateway resource status
Status | Description |
green | Indicates that API Gateway resource types like memory, disk space, and service threads are available to run. |
yellow | Indicates that API Gateway does not have adequate resources to run. When the API Gateway resource status is yellow, the overall status of API Gateway is yellow. |
Terracotta Server Array status
Status | Description |
green | Indicates that Terracotta server is in a healthy state. When the status of Terracotta server signals green, the overall status of API Gateway is green. |
red | Indicates that Terracotta server is not in a healthy state. When the status of Terracotta server signals red, the overall status of API Gateway is red. |
A sample HTTP response is as follows:
{
"status": "green",
"elasticsearch": {
"cluster_name": "SAG_EventDataStore",
"status": "yellow",
"number_of_nodes": "1",
"number_of_data_nodes": "1",
"timed_out": "false",
"active_shards": "95",
"initializing_shards": "0",
"unassigned_shards": "92",
"task_max_waiting_in_queue_millis": "0",
"port_9240": "ok",
"response_time_ms": "526"
},
"is": {
"status": "green",
"diskspace": {
"status": "up",
"free": "908510568448",
"inuse": "104799719424",
"threshold": "101331028787",
"total": "1013310287872"
},
"memory": {
"status": "up",
"freemem": "425073672",
"maxmem": "954728448",
"threshold": "92222259",
"totalmem": "922222592"
},
"servicethread": {
"status": "up",
"avail": "72",
"inuse": "3",
"max": "75",
"threshold": "7"
},
"response_time_ms": "258"
},
"terracotta": {
"status": "green",
"nodes": "1",
"healthy_nodes": "1",
"response_time_ms": "22"
}
}
The overall engine status is green since all components work as expected.
Administration Service Health Probe at Node-Level
To check the availability and health status of the API Gateway administration service (UI, Dashboards) on a particular API Gateway node, use the following rest endpoint:
GET /rest/apigateway/health/admin
The following table shows the response code and the description.
Response | Description |
200 OK | Administration service health check is successful. |
500 Internal server error | Denotes a problem. The response JSON indicates the problem. |
timeout or no response as the request did not reach the probe | Several factors can contribute to the delay when you initiate the Administration Service Health Probe, which may result in the timeout errors. To know the reasons for timeout errors, see
Causes for timeout errors for more information. |
The overall Administration Service Health Probe status can be green or red based on the API Gateway administration service's status and Kibana's status.
Kibana status
Status | Description |
green | Indicates that Kibana's port is accessible. When the status signals green, the overall status of Administration Service Health Probe is green. |
red | Indicates that either Kibana's port is inaccessible or Kibana's communication with API Data Store is not established. When the status signals red, the overall status of Administration Service Health Probe is red. |
API Gateway administration service status
Status | Description |
green | Indicates that API Gateway administration service is available. When the status signals green, the overall status of Administration Service Health Probe is green. |
red | Indicates that API Gateway administration service is not available. When the status signals red, the overall status of Administration Service Health Probe is red. |
A sample HTTP response is as follows:
{
"status": "green",
"ui": {
"status": "green",
"response_time_ms": "40"
},
"kibana": {
"status": {
"overall": {
"state": "green",
"nickname": "Looking good",
"icon": "success",
"uiColor": "secondary"
}
},
"response_time_ms": "36"
}
}
The overall status is green since API Gateway administration service and Kibana is in a healthy state.
How do I collect metrics?
To check the usage of the application and system parameters, use the following metrics endpoint: GET /metrics. When the endpoint is called, API Gateway gathers metrics and returns the data in the Prometheus format.
Note:
Prometheus is a non-
Software AG dashboarding tool that helps in trend analysis. For more information, see
https://prometheus.io/.
Prometheus metrics are exposed through the following endpoint.
[http|https]://host:port/metrics
The metrics endpoint by default is available on the following ports:
Default primary port (http). 5555
Default secure port (https). 5543
Default diagnostic port (debug port). 9999
A sample for the metrics endpoint is as follows:
http://server:5555/metrics
Authentication for the metrics endpoint
By default, the authentication is disabled when running
API Gateway as Docker container.
For on-premise installations, the following environment variable can be set to switch off the authentication for the metrics endpoint:
SAG_IS_METRICS_ENDPOINT_ACL=Anonymous
The endpoint also exposes the Integration Server Prometheus metrics. For more details on the Integration Server Prometheus metrics, see Developing Microservices with webMethods Microservices Runtime.
Exposing API Gateway Prometheus Metrics over a dedicated port
The metrics endpoint can be made available on a custom port. After creating the port, add the following service to the port's allow list:
wm.server.query:getPrometheusStats
Similarly, the metrics endpoint can be removed from the default ports (5555 or 5543 or 9999) by removing the service from the allow or deny lists.