How Do I Generate Heap Dump?
Heap Dumps are vital artifacts to diagnose memory-related problems such as slow memory leaks, garbage collection problems, and java.lang.OutOfMemoryError. They are also vital artifacts to optimize the memory consumption. There are various platforms to generate a heap dump. This section explains few platforms from where you can generate a heap dump. You can choose any platform according to your requirement.
Prerequisites:

Java 7 version and above is considered for generating dumps.
To check the Process ID (PID) of the API Gateway JAVA application :
Linux: Run the following command ps –ef | grep java
Windows: JAVA PID is available in the Task Manager
Generate Heap Dump using jmap
The jmap tool is located in the JRE or JDK_HOME\bin folder. jmap tool generates heap dumps into a specified file location. To generate a heap dump:
Run the following command:
jmap -dump:format=b,file=file_path.bin PID
where:
pid. Process Id of the application, whose heap dump should be generated.
file_path. File path, where the heap dump has to be generated.
Example:
jmap -dump:format=b,file=/opt/tmp/heapdump.bin 37320
37320 is the PID and the opt/tmp/heapdump.txt is the location where the heap dump of the process is generated.
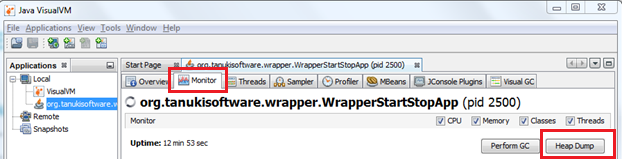
Generate Heap Dump using jVisualVM
Java VisualVM is a graphical user interface tool that provides detailed information about the applications while they are running on a specified Java Virtual Machine (JVM). jVisualVM is located in JDK_HOME\bin\jvisualvm.exe
1. Launch the jVisualVM.
2. Select your java application from the list in the left pane.
The left pane of the window lists all the java applications that are running on your system.
3. Click on the Monitor tab in the right pane.
4. Click Heap Dump button.
The Heap dump is generated.
Example:
HeapDumpOnOutOfMemoryError
When an application runs out of memory, it is ideal to generate heap dump right at that point to diagnose the problem. You can identify the objects that were occupying the memory and also the percentage of memory they were occupying when java.lang.OutOfMemoryError occurred. The following JVM parameter can be set while starting the Java application to generate the heap dump whenever Out Of Memory (OOM) exception occurs in the application.
-XX:+HeapDumpOnOutOfMemoryError -XX:HeapDumpPath=file_path
where file_path is the location and the name of the file, where the heap dump is generated.