
This document covers the following topics:
The creation of statistical charts is done by a library that is part of the Application Designer library.
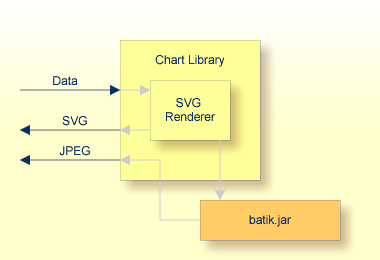
The library offers an API in which you pass the data to be rendered into a chart. It interprets the data and creates an SVG (scalable vector graphics) string out of it. This SVG string can be directly passed back to the calling application.
In addition, the SVG string can be rendered into a JPEG image. Internally, the Apache batik.jar is used for this purpose.
When should you use which format?
SVG is a vector format. This means that you can use it in printable documents because the quality of rendering is scalable.
JPEG is a format for pixel images. It is easily displayable in any browser. However, it has a limited printing quality.
The chart library in principle is a self-containing library, packaged into the cis.jar. The result can be flexibly used inside Application Designer.
The class CHARTInfo is the central class for
creating charts. See the Java API documentation. The infomation below will only
provide an example of how to use this library.
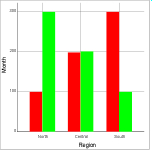
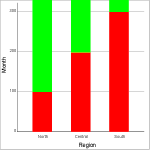
The following chart will be created:

Let us take a look at the Java program that creates the chart:
private void renderChart()
{
     CHARTInfo chart = buildChart();
     String svg = chart.getSVGBarChart();
}
private CHARTInfo buildChart()
{
    // CHARTInfo chart = new CHARTInfo("300","300"); // width/height
    // set descriptions
    chart.setXAxisDescription("Region","#000000");
    chart.setYAxisDescription("Month","#000000");
    // Define x-axis
    chart.addXAxisScale("North");
    chart.addXAxisScale("Central");
    chart.addXAxisScale("South");
    // Define "value lines"
    chart.addDataDescription("January","#FF0000");
    chart.addDataDescription("February","#00FF00");
    // Define values
    chart.addData("North","January",100);
    chart.addData("Central","January",200);
    chart.addData("South","January",300);
    chart.addData("North","February",300);
    chart.addData("Central","February",200);
    chart.addData("South","February",100);
    return chart;
}
The program is split into two methods: one method
(buildChart) fills a CHARTInfo object with data. The
other method (renderChart) takes the result and
triggers the output of the SVG information.
First have a look at the buildChart()
method:
A CHARTInfo object is intialized.
The names of x- and y-axis are defined.
The scale of the x-axis is defined.
Value lines are defined - each value line represents one set of values that forms one line.
Data is passed into the CHARTInfo object.
At the end, the chart information is logically filled.
The rendering is triggered at the point of time when accessing the
CHARTInfo's getSVG*() or
getJPEG*() methods. This is done in the example's
renderChart() method. For each type of graphic, you
have a different method.
Examples:
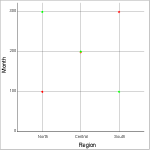
The SVG methods return an SVG string. There are corresponding other methods that return a JPEG file.
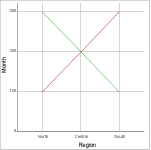
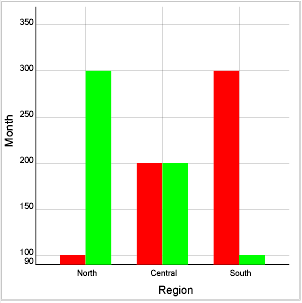
If the scale of the y-axis is not specified explicitly, the scale will be calculated automatically:
In case of only positive data values, the bottom of the scale will be "0". The top will be the maximum data value that is found. Between "0" and the maximum value, some interim scale figures will be added that are clean decimal figures.
In case of both positive and negative values, the bottom of the scale will be the minimum value.
You can also set the scale on your own.
To do so, use the following method:
chart.setYAxisDimension(90,350);
The system will still try to find optimal interim scale values. However, you also can set the y-scale completely on your own:
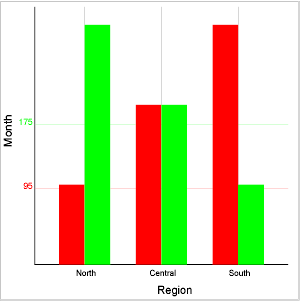
The code for doing so is:
chart.addYAxisScale(95,"#FF0000");
chart.addYAxisScale(175,"#00FF00");