
The chart library is not bound to the reporting functions, but can of
course be used there in a simple way. You can produce charts and directly embed
them into your report. The REPORTInfo class hides the
internal complexity that is involved in doing this.
This document covers the following topics:
Have a look at the following code:
private void renderChart()
{
// headline in front of chart
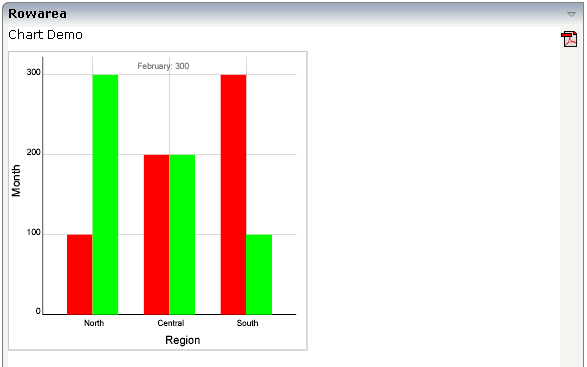
m_report.addText("Chart Demo");
CHARTInfo chart = buildChart();
m_report.addVerticalDistance("10");
String svg = chart.getSVGBarChart();
m_report.addSVGsource(svg,"300", // width
"300", // height
"0"); // indent
}
private CHARTInfo buildChart()
{
// CHARTInfo chart = new CHARTInfo("300","300"); // width/height
// set descriptions
chart.setXAxisDescription("Region","#000000");
chart.setYAxisDescription("Month","#000000");
// Define x-axis
chart.addXAxisScale("North");
chart.addXAxisScale("Central");
chart.addXAxisScale("South");
// Define "value lines"
chart.addDataDescription("January","#FF0000");
chart.addDataDescription("February","#00FF00");
// Define values
chart.addData("North","January",100);
chart.addData("Central","January",200);
chart.addData("South","January",300);
chart.addData("North","February",300);
chart.addData("Central","February",200);
chart.addData("South","February",100);
return chart;
}
It creates an SVG graphic by using CHARTInfo and directly places the SVG graphic into a report. The output looks as follows:
Nearly the same code is required for creating the graphic as an JPEG file:
private void renderChart()
{
    ...
    String svg = chart.getSVGBarChart();
    byte[] jpegBytes = chart.transformChartToGraphic(svg,CHARTInfo.CREATEJPEGIMAGE);
    m_report.addJPEGsource(jpegBytes);
    ...
}

private CHARTInfo buildChart()
{
    ...
    ...
    ...
}
By using the transformChartToGraphic() method,
you can translate generated SVG into various file formats (JPEG, PNG,
TIFF).
You may already have recognized that in the previous examples the CHARTInfo object was initialised in the following way:
CHARTInfo chart = new CHARTInfo("300","300");
On the other hand, when placing the generated SVG into the report output, again the size was passed:
m_report.addSVGsource(svg,"300", // width
                          "300", // height
                          "0"); // indent
Make sure that both sizes are the same.
When using SVG for reporting, you do not pass sizes like
"4 cm" but you pass pixel values. Pixel values are
transferred into metric sizes within a calculation factor. You can change the
calculation factor by using the method
REPORTInfo.setFactorForTransformPixel2PDF(...).