Using the Terracotta Management Console
The TMC Home Page
The TMC home page is where you:

create/delete persistent connections to your cluster(s)
optionally modify your connection properties
view
the status of the servers that make up your cluster
the various categories of clients making use of your cluster
the server entities that are contained by the cluster and to which clients connect
drill-down/jump to various presentations such as statistics and monitoring relating to those servers, clients, and entities
take actions, such a clearing the contents of a cache
Tip: TMC requires browser cookies to work. Please make sure your browser doesn't block reading cookies (some browser plugins can block reading cookies). If you see a related error message, you can try another browser, or use incognito mode, or disable browser plugins.
For information about starting and stopping Terracotta servers, refer to the section
Starting and Stopping the Terracotta Server in the
Terracotta Server Administration Guide.
For information about creating Terracotta clusters, refer to the section
Cluster Tool in the
Terracotta Server Administration Guide.
Connections and Global Settings
To create a persistent connection to a particular operational cluster:
1. Click Create New Connection
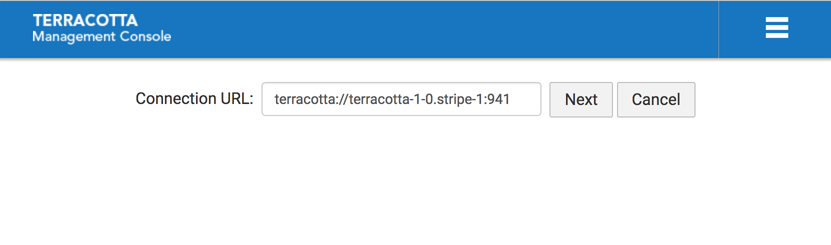
2. In the Connection URL input area enter a URL addressing at least a single, running member of the fully configured Terracotta Server Array (TSA):
Screenshot: TMC Home Page. Connection URL to at least one running member of the TSA
Terracotta Server URL
terracotta://<server-host>:<listen-port>[,<server-host>:<listen-port>]*
If the TMS is able to connect to the specified server, it will request the complete TSA topology, persisting the addresses of each server in its database. This means that, in the future, the TMS will be able to connect to the TSA, even if the originally specified server should be unreachable, as long as at least one member of the TSA is running.
If you attempt to connect to a running server that is not part of a configured cluster, the TMS will return an error indicating that no license was discovered.
It is a best-practice to specify the addresses of all the members of a particular TSA stripe in the connection URL to support high-availability. Simply comma-separate each server's address (host:port).
The TMS will attempt to connect to each server, in turn, until a successful connection is established.
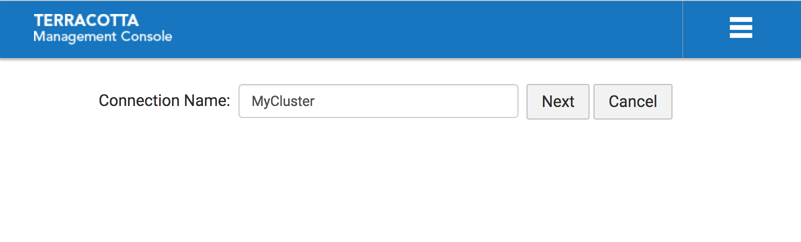
3. Enter the name you would like associated with this connection, for example "MyCluster", then click Next to create the connection.
Screenshot: TMC Home Page, Connection Name
This connection name will be used to disambiguate multiple connections in the UI and when communicating with the TMS REST interface.
4. Upon completion of creating the new connection, a new connection region is shown on the Home Page, displaying the current state of your cluster.
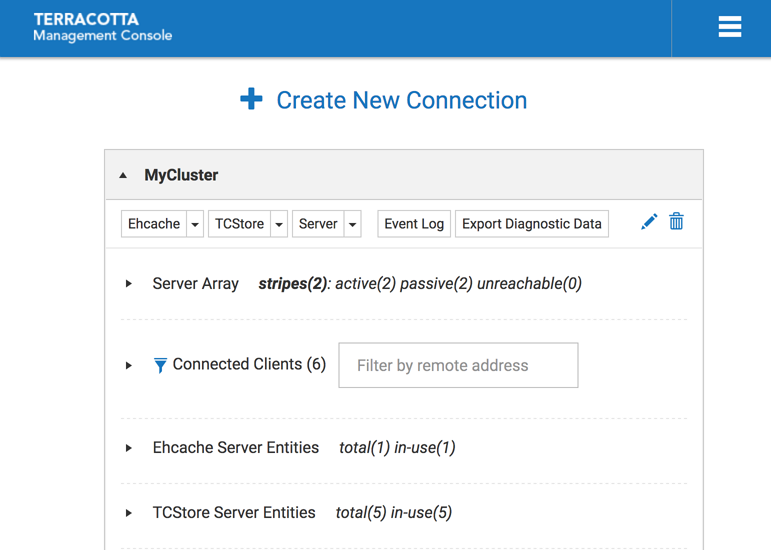
Screenshot: TMC Home Page, State of the TSA after initial entries.
The connection to MyCluster in the example above shows a TSA comprised of 2 stripes, each containing a pair of Active-Passive servers, 4 currently connected clients, a single Ehcache server entity and a single TCStore server entity. Further detail can be exposed by drilling down into the display hierarchy.
Note: For Terracotta Ehcache product users, the TCStore dropdown is deactivated.
Modifying a Connection's Properties
If you wish to modify your new connection’s properties, use the
Edit this cluster (

) icon on the connection’s header area.
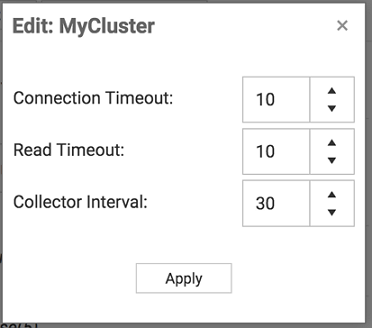
Screenshot: TMC Cluster Properties Editor (Overlay)
Connection Timeout | Timeout value, in seconds, when connecting to a cluster the first time or when reconnecting. Default is 10 seconds. |
Read Timeout | Timeout value, in seconds, for all cluster communications. Default is 10 seconds. |
Collector Interval | Collector interval for statistics. Default is 30 seconds. Minimum is 10 seconds and maximum is 60 seconds. |
Deleting a Connection
To delete an existing connection use the
Delete this cluster (

) icon on the connection header area.
Screenshot: TMC Connection Area Header
Using the Configured Connections
The TMC home page shows each of your configured connections in its own collapsible region of the display that presents the totality of the cluster, allowing you to drill-down to different levels of hierarchy then jump to various detail views, such as for statistics or an entity's server-side resource usage.
Each configured connection region is comprised of several high-level facets which will now be described.
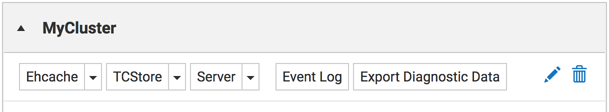
Buttons in the connection region header
The header of the connection region for a selected cluster contains the following selectable buttons:
Ehcache TCStore Server Events Export Diagnostic Data If you select the Ehcache, TCStore, Server or Events button, the Detail page will be displayed, with the appropriate tab (Ehcache, TCStore, Server or Events) already selected.
Each of these three buttons contains a dropdown menu. If you select an item from any of these dropdown menus, the Detail page will be displayed and the details for the selected dropdown entry will be in focus.
For information about the button Export Diagnostic Data, see the following topic.
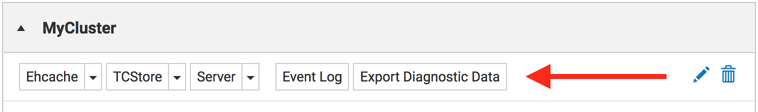
Export Diagnostic Data (Cluster level)
The Export Diagnostic Data button at the cluster level provides diagnostic information for every server in the cluster.
Screenshot: TMC Connection Area Header, Highlighting button for Export Diagnostic Data
The cluster level Export Diagnostic Data button exports the following diagnostic data as a zip file.
Event Log - a csv file named
EventLog.csv, containing cluster wide events. This can also be exported from the
Events panel.
For each server it also downloads 6 diagnostic data files, which are explained in the next section,
View Diagnostic Details (Server level).
The zip file is named using the format: diagnostic-connectionName-dateTime.zip
e.g.
diagnostic-myClusterConnection-20170705221353.zipand the layout of the zip file is:
one folder for each stripe, which contains one folder for each server within the stripe
each server folder contains the 6 files referenced in the next section,
View Diagnostic Details (Server level)in the root of the zip file there is the cluster wide event log,
EventLog.csvServer Array
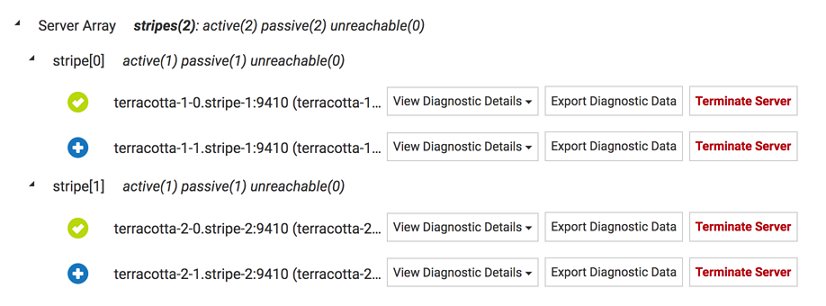
The Terracotta Server Array (TSA) is a collection of groups of servers, known as stripes. Servers within a stripe work together to provide High-Availability. If the Active server should fail, any one of the remaining Passive servers takes over as active. The Active server serves to (1) handle requests from clients to entities it contains and (2) to relay those client requests to each of the Passive servers. Servers in different stripes do not interact.
The TMC presents the current state of the server array, indicating the roles of each server. The following shows a server array consisting of two stripes, each containing two members, one active and one passive.
Screenshot: Example of a TMC Terracotta Server Array, two stripes, each having two members, one active, one passive.
The possible server states are:
Icon | Server state | Description |
| STARTING | server is starting |
| UNINITIALIZED | server has started and is ready for election |
| SYNCHRONIZING | server is synchronizing its data with the current active server |
| PASSIVE | server is passive and ready for replicatio |
| ACTIVE | server is active and ready to accept client |
| ACTIVE_RECONNECTING | server is active but waits for previously known clients to rejoin before accepting new clients |
| ACTIVE_SUSPENDED | server is active but blocked in the election process (consistency mode) |
| PASSIVE_SUSPENDED | server is passive but blocked in the election process (consistency mode) |
| START_SUSPENDED | server is starting but blocked in the election process (consistency mode) |
| UNREACHABLE | server is unreachable from TM |
| UNKNOWN | default server state shown in TMC before TMC is able to access the server stat |
Diagnostic information for the members of your TSA can be downloaded as an archive file or viewed directly.
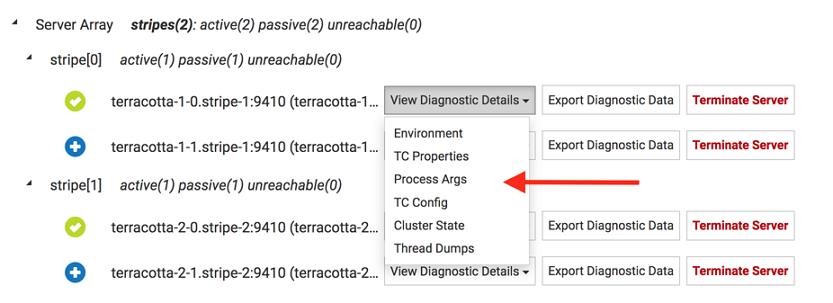
View Diagnostic Details (Server level)
The View Diagnostic Details dropdown at the server level lets you view directly the diagnostic information for that particular server. There is one diagnostic data dropdown per server and it is always positioned to the immediate right of the server name.
Screenshot: Example of a TMC Terracotta Server Array, dropdown highlighted in action.
Note: Please don't confuse the stripe count with the stripe name. In this example there are two stripes, indicated by stripes(2), and they are named stripe[0] and stripe[1].
Export Diagnostic Data (Server level)
The Export Diagnostic Data button at the server level lets you download diagnostic information for that particular server in an archive file, similar in format to that provided at the cluster level.
The dropdown provides access to the 6 diagnostic data files below. The file contents can be viewed/exported individually by selecting that option from the dropdown or by selecting the top level Export Diagnostic Data option which exports a zip file containing all of them.
1. Environment - shows a list of all the environment variables.
2. TC Properties - provides a list of all the TC config properties.
3. Process Args - displays all the command line arguments submitted for the process.
4. TC Config - shows the Terracotta configuration file.
5. Cluster State - displays information on the current cluster state.
6. Thread dump - exports the thread dump as a txt file.
Tip: What is a thread dump? A Java thread dump is a way of finding out what every thread in the JVM is doing at a particular point in time. This is especially useful if your Java application sometimes seems to hang when running under load, as an analysis of the dump will show where the threads are stuck.
The zip file is named using the format: diagnostic-connectionName-stripeName-serverName-dateTime.zip
e.g.
diagnostic-myClusterConnection-stripe[0]-testServer0-20170705221356.zipand the layout of the zip file is one folder, named after the server name, containing the 6 data files above.
Connected Clients
In the Terracotta Platform, a client is an application end-point. In your application, the clustered CacheManager that is configured and initialized is a Terracotta client. Each client maintains a connection to the active server in each stripe. In general, anything that connects to a server is considered a client.
Each client has a Client Identifer that serves to uniquely identify that client. The form of the identifier is:
<pid>@<ip-addr>:<client-type>:<server-entity-name>:<uuid>
where:
<pid> | the process identifier of the Java Virtual Machine hosting this client |
<ip-addr> | the IP address of the machine hosting this JVM |
<client-type> | [Ehcache | Store | Unknown] |
<server-entity-name> | the name of the server-side entity the client is connected to |
<uuid> | a unique identifier that serves to disambiguate clients in the same JVM, accessing the same server entity |
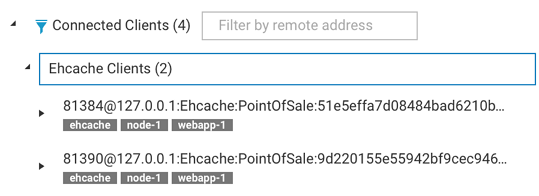
Ehcache Clients The following shows two caching clients.
Screenshot: Example Connected Clients: Two caching clients.
The input field located next to Connected Clients serves to show only those clients whose identifier contains the entered value. In the example above, entering 81390 (the process identifier of the 2nd client) would filter out the first client.
Filtering Rules
accepts a space-separated list of terms to match (prefix with ! to negate)
terms can apply to any components of the
Client Identifier or any supplied tags
negated terms must not match any of the above
clear the input field content or click the toggle button (

) to show all clients
Under each identifier is an optional set of user-defined tags, specified in the CacheManager's configuration.
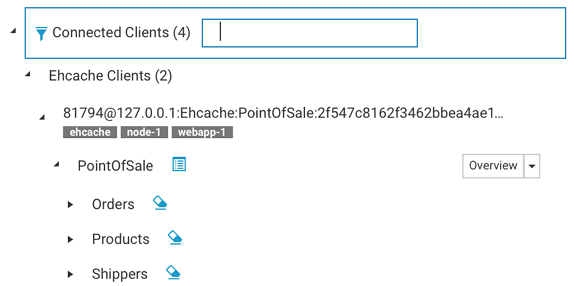
Expanding a
caching client exposes the CacheManager’s alias, which is defined in the configuration. The dropdown lets you jump to various detail views, pre-selecting this client and CacheManager in those views. View the CacheManager’s configuration by selecting the
configuration (

) icon. The cache entries can be cleared by selecting the
clear cache (

) icon.
Screenshot: TMC Cache Manager's Configuration, elements collapsed
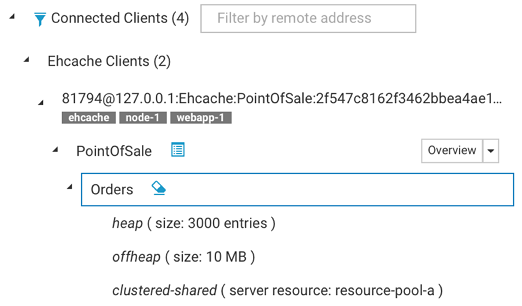
Expanding the cache shows important configuration elements related to that cache.
Screenshot: TMC Caching ClientExpanded
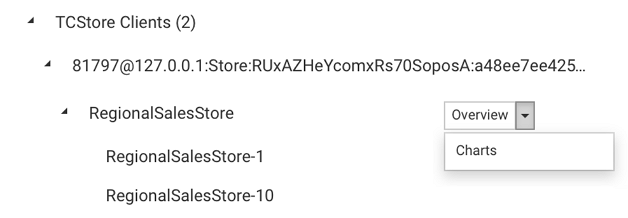
TCStore Clients Within the connected clients section there is also a subsection for all the dataset clients.
Expanding the TCStore Clients section provides a list of all the connected clients, ordered by client identifiers.
Further expanding a client identifier shows all datasets associated with that particular client and for each dataset there is a dropdown to navigate quickly to its overview or chart statistics.
Lastly when expanding each dataset there is also a list of all its dataset instances
Screenshot: Expanding a Client Identifier
Ehcache Entities
The Terracotta Platform consists of client-side programmatic (API) artifacts and server-side entities that work together to provide highly-available, performant, distributed data access. In your application you configure a CacheManager, both on the client- and server-side. The client-side configuration relates to such things as the maximum OnHeap size-in-bytes for a particular cache. The server-side configuration relates to the remote storage tier that is used to store your cache entries.
Each of your Ehcache Clients communicates with its remote storage tier when executing normal cache operations, such as putting an entry into the cache.
Ehcache clients configured to use the same remote storage tier are effectively sharing access to the same cache data.
TCStore Entities
A TCStore client is essentially a connection to a clustered or embedded Dataset.
A single client instance can fetch an arbitrary number of handles to the underlying Dataset, referred to as a Dataset instance. Operations statistics are maintained on a per-instance basis.