Using the Events Tab
The Events tab displays the contents of the event log, in reverse chronological order. The event log is a record of important activities occurring in your cluster. The TMS listens for and persists these events, meaning that if the TMS is not running no events will be stored.
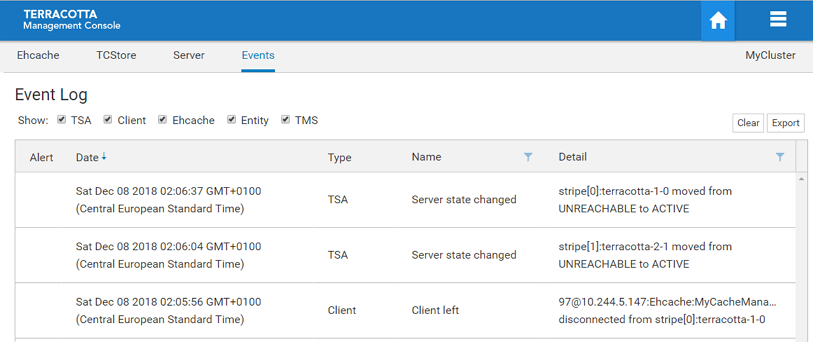
Event Log
Screenshot: TMC Event Log
The types of activities that generate events include:

server state transitions
clients connecting/disconnecting to TSA stripes
server entities being created/destroyed
resource constraint alerts
and more
The event log is included in the set of diagnostics artifacts that can be downloaded from the cluster's connection panel on the Home Page, but in addition it can be downloaded separately using the Export button.
Events that are deemed to be critical are noted as alerts, displayed with an attention-focusing icon in the alert grid. Further, alert events are displayed in a temporary popup and the count of un-read alerts is shown in the cluster's connection panel on the Home Page.
Newly added events are shown in the grid with bold text, and reset to normal after navigating away.
An event is comprised of the following fields:
alert | Is this event deemed critical? |
Timestamp | Time at which the TMS recorded the event |
Type | Categorization of the event |
Name | Sub-categorization |
Detail | Description of the event |
The maximum number of events that are saved in the TMS is controlled by the configuration property tms.eventLogMaxRecords, whose default value is 5000. The event log store in the TMS, as well as the event log grid, can be cleared using the Clear button.