
This section describes the features of the test editors, such as navigation options and toolbar icons. The following example shows the Test Subprogram editor. The test editors are similar for both business services and subprograms; the main differences between the editors are that the Debug option is not available in the Test Business Service editor and you can select the method to test (which can change which subprogram is tested internally).
In this example, the INPUT-DATA and OUTPUT-DATA fields have been expanded:
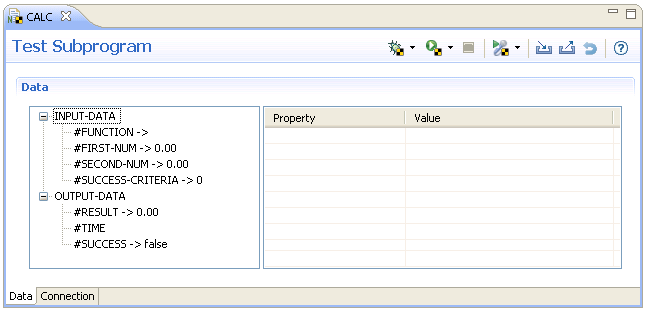
Keyboard navigation is supported in all editors. In the example above, you can use keys on the keyboard to move from one field to another in the tree view and/or navigate to the table on the right to add or edit values.
The following table describes each of the options available on the editor toolbar:
| Toolbar Icon | Description |
|---|---|
|
|
Debugs the current subprogram using the
NaturalONE debug attach server and the current values defined in the editor.
For information, see Debug a Subprogram
Directly.
Note: |
|
|
Runs the current file using the values
defined in the editor. Use the down arrow to display the available environments
in which to run the test and select a different environment. For example:
|
|
|
Stops the current test. |
|
|
Records the test data for export to a CSV
file (file extension .csv), which can then be used as
input for an external data unit test. After selecting this option, either the
record function for the test will begin or the Define External Test
Details panel will be displayed to define the external data unit
test. To change details about the recording, select the down arrow. For
example:
The Define External Test Details panel is displayed. For more information, see Export Test Data to a CSV File. |
|
|
Exports test data (field names and values) from the data tree in the test editor view to a new or existing test data file (extension .tstdata) in the workspace. For information, see Export Test Data. |
|
|
Imports an existing test data file in the workspace to the data tree in the test editor view by matching field names in the imported test data file to field names in the editor tree. For information, see Import Test Data. |
|
|
Resets all data values and structures to their default values. |