
This document shows the most important steps for handling programs with Natural Studio, including testing and debugging.
For more information, see Program Editor in the Editors documentation of Natural for Windows.
For detailed information on the debugger, see the Debugger documentation of Natural for Windows.
This document covers the following topics:
You will now create a small program which prompts the user for input and displays this input. You can create this program in any library that you are allowed to use in the remote development environment.
 To create a program
Select the name of the library in the remote development environment in which you want to store the new program.
From the menu, choose .
Or:
Invoke the context menu and choose .
Or:
Press CTRL+N.
Or:
Choose the following toolbar button:
![]()
An empty program editor window appears.
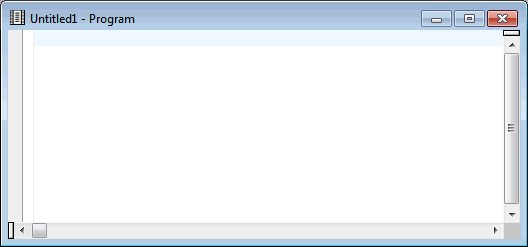
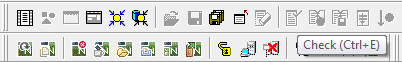
The status bar at the bottom of the Natural Studio window now shows additional information (line and column in which the cursor is currently positioned and the current size of the program). When the program editor window is the active window, all toolbar buttons that apply to a program are activated. When you move the mouse over a toolbar, tooltips appear. For example:
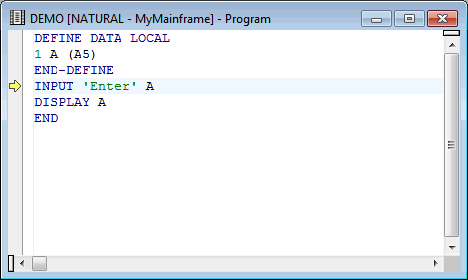
In the program editor, enter the following code:
DEFINE DATA LOCAL
1 A (A5)
END-DEFINE
INPUT 'Enter' A
DISPLAY A
END
Tip:
Copy the above code (i.e. select the code with the
mouse and press CTRL+C) and paste it in the program editor window
(i.e. go to Natural Studio, select the program editor window and press
CTRL+V).
You will now stow the program you have just created.
Since it is possible to edit several programs at the same time (this is not possible, for example, on the mainframe), you have to make sure that the editor window for the program that you want to stow is the active window. To activate a window, you simply have to select it.
To stow a program
Make sure that the editor window containing your new program is active.
From the menu, choose .
Or:
Press CTRL+T.
Or:
Choose the following toolbar button:
![]()
The Stow As dialog box appears.
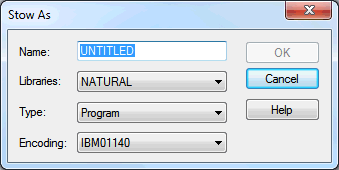
In the Name text box, enter "DEMO" as the name of your program.
To stow the program in the current library, choose the button.
If you have not switched off the success messages, a dialog box appears, informing you that the stow operation was successful. When this dialog box appears, press ENTER to close it.
The new program is now shown in the library workspace. The title bar of the program editor window now shows the program name, the library in which it is stored, and the environment name of the current development server.
Close the program editor by choosing the standard close button at the top right of the program editor window.
You will now execute your DEMO program.
To execute a program
In the library workspace, select the program DEMO.
Invoke the context menu and choose .
Or:
Choose the following toolbar button:
![]()
The INPUT statement from the above example
program invokes either a terminal emulation window or a window for the Web I/O
Interface (depending on the settings on the remote development server; see the
description in the previous section). You are
prompted for input.
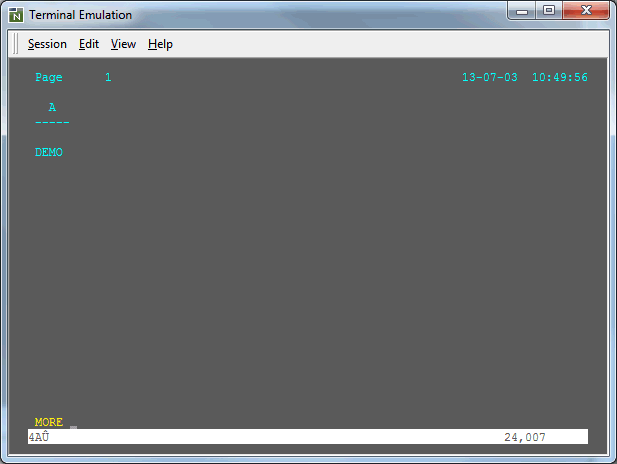
Enter the string "Demo" at the Enter prompt and press ENTER.
The DISPLAY statement from the above
example program now shows the string you have just entered. Example for the
terminal emulation window:
Press ENTER once more.
The example program is ended and the window in which it was shown is automatically closed.
You will now debug your DEMO program.
To debug a program
In the library workspace, select the program DEMO.
From the menu, choose .
Or:
Invoke the context menu and choose
.
Or:
Press CTRL+F7.
Or:
Choose the following toolbar button:
![]()
When the editor for the selected object has not yet been opened, it
is opened now and the debugger is started. The trace position is shown at the
first executable source code line (i.e. the line containing the
INPUT statement).
In addition, the following debugger windows are shown:
Variables Window
This window shows all variables which are available at current
state of the program execution.
Break- and Watchpoints Window
This window shows all currently defined breakpoints and
watchpoints.
Call Stack Window
This window shows the objects which have been called during the
current debugging session in hierarchical order.
From the menu, choose .
Or:
Press F11.
Or:
Choose the following toolbar button:
![]()
The next program step is executed and the trace position is shown at the corresponding source code line. If this source code line invokes or includes a further Natural object, the debugger steps into this object and the trace position is shown at the first executable line.
In case of your program, the INPUT
statement invokes either a terminal emulation window or a window for the Web
I/O Interface (depending on the settings on the remote development server; see
the description in the previous section).
Enter the string "Demo" at the Enter prompt and press ENTER.
The window in which you have entered the string is closed. In the
editor window, the trace position is now shown in the next executable source
code line. In case of your program, this is the line containing the
DISPLAY statement.
Choose the command
repeatedly until the output of the DISPLAY statement
is shown in the window.
To close the window in which the output is shown, press ENTER.
The debugger is terminated automatically if the application ends without an error.
Close the program editor by choosing the standard close button at the top right of the program editor window.
You can now proceed with the next exercise: Locking and Unlocking.