This document provides general information on profiling Natural applications.
A profiler is a tool for dynamic program analysis. It measures the frequency and duration of instructions to simplify program optimization.
The Natural Profiler is used to profile Natural applications. It collects profiling data whenever a defined Natural event occurs, for example, when a program starts or before a database is called. The Natural Profiler visualizes the recorded event data as an event trace and the calling structure of the executed Natural objects as a program trace. The performance evaluation provided by the Natural Profiler shows the time consumption and hit count of the executed objects, Natural statements and program lines.
You can view Natural Profiler event data in the Profiler utility output or export the data in text or table format. You can visualize Natural Profiler performance analyses in NaturalONE (Software AG’s Eclipse-based development environment) or MashZone (Software AG’s tool for creating interactive business dashboards).
A Natural Profiler analysis serves as the basis for performance optimization of a Natural application. The Natural Profiler provides you with a very fast overview about the time-consuming parts of a Natural application. No code modification is required, and moreover, just basic knowledge of the application is sufficient.
You can profile Natural applications on UNIX, Windows and mainframe platforms. How to profile a Natural application depends on the platform and the application processing mode used:
Mainframe interactive applications are profiled with the NaturalONE Profiler or the Profiler utility in online mode.
Mainframe interactive applications executed remotely from Natural Studio or RPC are profiled with the Profiler utility in batch mode.
Mainframe batch applications are profiled with the Profiler utility in batch mode.
UNIX and Windows interactive applications are profiled with the NaturalONE Profiler or the Natural Profiler for UNIX and Windows, respectively.
UNIX and Windows batch applications are profiled with the Natural Profiler for UNIX and Windows, respectively.
This section summarizes the key features of the Natural profiling tools:
Profiles interactive Natural applications from UNIX, Windows or mainframe platforms in an Eclipse-based development environment.
Reads and analyzes Profiler resource files containing event data collected by the mainframe Profiler utility in batch mode or by the Natural Profiler for UNIX and Windows.
Provides features for big data handling:
Event filter,
Sampling technique,
Data consolidation.
Performance analyses of programs, statements and program lines:
CPU time,
Elapsed time,
Hit count.
Displays an event trace.
Provides direct navigation from a profiled program line to the corresponding source code.
Saves and reloads the Profiler data as an XML-formatted file.
Profiles interactive or Natural batch applications from UNIX or Windows platforms.
Provides features for big data handling:
Event filter,
Sampling technique,
Data consolidation.
Saves the Profiler data as a Profiler resource file.
- Online Mode (Mainframes)
Profiles interactive Natural applications from mainframe platforms.
Provides an event filter.
Displays an event trace.
Saves the Profiler data in a table format.
Saves the Profiler data as a Profiler resource file.
Note:
The amount of data collected by the Profiler utility in online mode is restricted by the relatively small size of the Natural Data Collector buffer which works in a wrap-around mode. Moreover, when running under CICS or Com-plete, the CPU time is not provided. In general, we recommend that you use the NaturalONE Profiler for profiling interactive Natural mainframe applications because the NaturalONE Profiler has no size restrictions and supports CPU performance analyses.- Batch Mode (Mainframes)
Profiles Natural batch and Natural RPC applications from mainframe platforms.
Profiles mainframe interactive applications executed remotely from Natural Studio.
Provides features for big data handling:
Event, program, count and time filters,
Sampling technique,
Data consolidation.
Saves Profiler data as a Profiler resource file.
Reads and analyzes Profiler resource files.
Prints program and event traces.
Analyzes program performance.
Collects and displays Profiler properties and statistics.
Exports Profiler data for MashZone visualization.
- Batch Mode (UNIX and Windows)
Reads and analyzes Profiler resource files.
Provides features for big data handling:
Data consolidation.
Saves consolidated Profiler data as a Profiler resource file.
Prints program and event traces.
Analyses program performance.
Displays Profiler properties and statistics.
Exports Profiler data for MashZone visualization.
Visualizes Profiler data on a graphical, interactive MashZone dashboard.
Analyzes application performance with selection criteria such as library, program, program line and user:
CPU time,
Elapsed time,
Adabas command time,
Hit count.
Displays Profiler properties and statistics.
This section describes the evaluations provided by the Natural profiling tools:
You can analyze program performance with the Natural Profiler to identify critical sections of source code.
- Program Summary Report
The Natural Profiler Program Summary report of the Profiler utility shows the CPU time spent during Natural program execution. It also shows which and how many Natural events occurred.
Example:
In the extract of a Program Summary above, the
MONADAprogram used25.98percent of the CPU time (680 ms) and executed272180statements. It was started once, loaded3176other Natural objects and issued71database calls. The programADA-RCcalled45external programs. One error occurred in the programSPSTATE.- Hot Spots Page
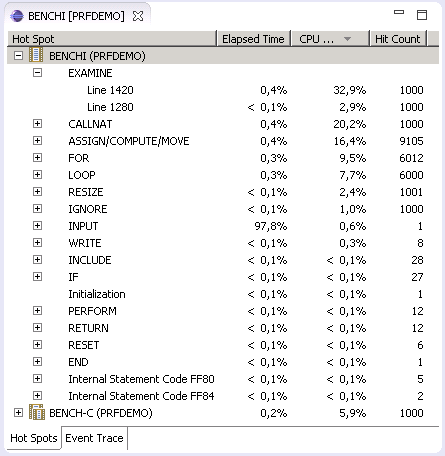
The Hot Spots page of the NaturalONE Profiler shows the CPU time and the elapsed time used by Natural objects, statements and program lines. It also shows how often an object or statement executed. From a profiled program line you can directly navigate to the corresponding source code line.
Example:
In the example above, the highest percent of CPU time was used by the
EXAMINEstatement in Line1420in theBENCHIprogram which was executed1000times. If you double-click on the entry ofLine 1420, the NaturalONE editor opens the program source ofBENCHIand positions on the corresponding line.- Evaluation Page
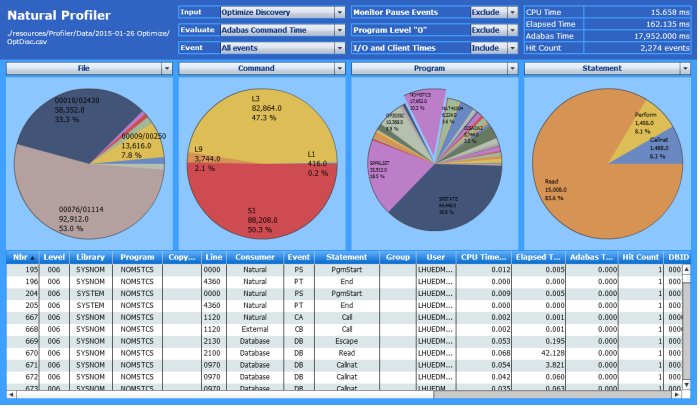
The Evaluation page of the Natural Profiler MashApp visualizes the Profiler data on an interactive MashZone dashboard. You can evaluate the distribution of the CPU time, the elapsed time, the Adabas command time or the hit count using the following criteria:
Consumer (such as Natural or a database )
Event
Group (group of users as defined in Natural Security)
Level (program execution level)
Library
Line
Line100 (lines with similar line number)
Program
Statement
User (for Natural RPC applications running under Natural Security)
Client User
Command (Adabas database call)
File
Return Code
Target Program
Type (for example, object type subprogram for a program start event)
Example:
The pie charts in the example above show the distribution of the Adabas command time (selected in the header) for the following criteria (selected above the pie charts):
Adabas files,
Adabas commands,
Natural programs, and
Natural statements.
In the pie chart below Program, the
NOMSTCSprogram has been selected by clicking on the corresponding segment. Therefore, the pie chart below Statement shows the distribution of the Adabas command time over the statements of theNOMSTCSprogram only.
The Program Trace provided by the Natural Profiler utility shows the program flow of the profiled application. It lists all program events and shows which and how many events occurred between the program events.
Example:
Natural Profiler Program Trace ------------------------------ Time Ev Library CC-Name Line Lev Program Events 10:20:58.309812 PL 0000 000 10:20:58.311790 PR SYSEDMD 1210 001 .OPTTEST D=3 N=30 10:20:58.322550 PL SYSEDMD 7200 001 .OPTTEST 10:20:58.322573 PS SYSEDMD 0000 002 ..PROFREV D=5 N=18 10:20:58.323566 PL SYSEDMD 1040 002 ..PROFREV 10:20:58.323572 PS SYSLIBS 0000 003 ...NAT41004 D=3 C=6 N=344 10:20:58.335128 PT SYSLIBS 5235 003 ...NAT41004 10:20:58.335128 PR SYSEDMD 1040 002 ..PROFREV N=162 10:20:58.335260 PT SYSEDMD 2180 002 ..PROFREV 10:20:58.335260 PR SYSEDMD 7200 001 .OPTTEST D=3 I=4 N=128 ... 10:21:41.731229 PT SYSEDMD 7370 001 .OPTTEST 10:21:41.731229 PR 0000 000 D=14 I=1 10:21:42.248348 ST 0000 000 Totals ------ Ev Event Count S Session ................ 1 P Program ................ 5297 D Database Call .......... 2140 I Terminal I/O ........... 12 C External Program Call .. 6510 E Runtime Error .......... 43 N Natural Statement ...... 857384 R RPC Request............. 0 U User-Defined Event ..... 0 M Monitor Pause .......... 2 |
In the example above, the OPTTEST program calls
PROFREV which then calls NAT41004.
In Line 1210, OPTTEST performed a Program
Resume event (PR). It then executed 30 Natural statements
(N=30) and 3 database calls (D=3) before it loaded
PROFREV indicated by a Program Load (PL) event. The
Totals show how often the events occurred during the entire
Natural session.
The Event Trace provided by the NaturalONE Profiler and by the Natural Profiler utility lists the recorded event data in chronological order.
Example:
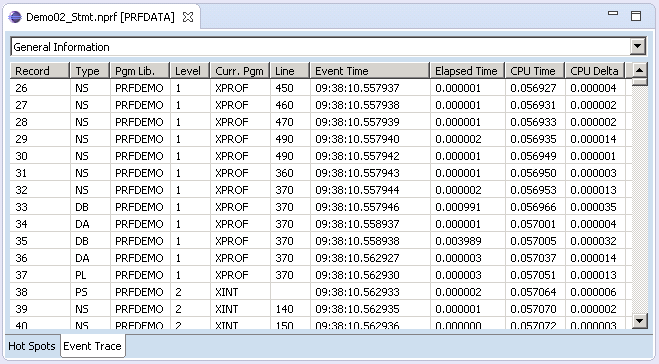
The example above shows general event data such as the library or program name. In addition to the recorded event and CPU timestamps, the NaturalONE Profiler displays the corresponding delta values (elapsed time and CPU delta, respectively). You can also view event-specific data such as the number of the file used for database calls.
The Profiler properties and statistics provided by the Natural Profiler utility and the Natural Profiler MashApp lists Profiler properties such as the Profiler revision, and statistics of the monitored application that show, for example, the total CPU time and the elapsed time.
Example:
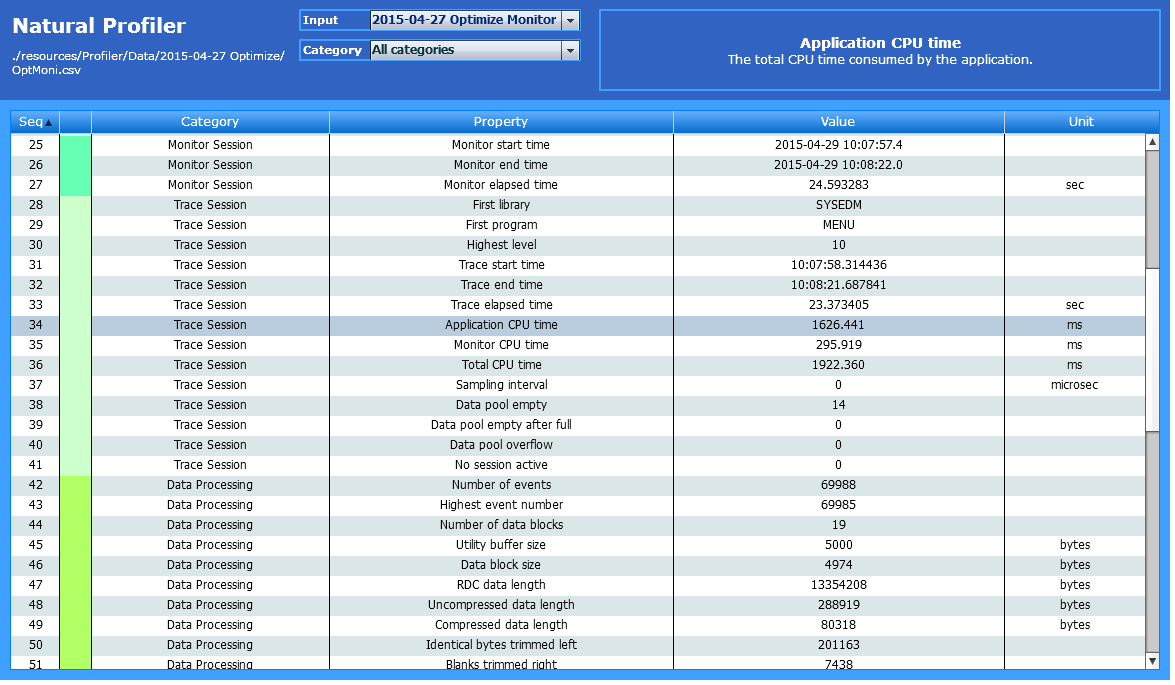
The example above shows statistics of the monitor session, the trace
session and the data processing. The monitor session was running for
24.59 seconds, the application consumed 1626.441
microseconds of CPU time, and the Profiler recorded 69988
events.