
The DataSync Overview Summary Page is the landing page for the DataSync administrator and provides real time information about synchronization jobs currently running in the system as well has historical summary information about completed jobs.
The Summary page is divided into two sections. The top section represents information about currently running Synchronization jobs and the bottom section provides a summary of historical syncs. Some functions on this screen use icons. The description of these icons will have a hyperlink to the Glossary of Icons which contains a picture of the icon and an explanation of its purpose.
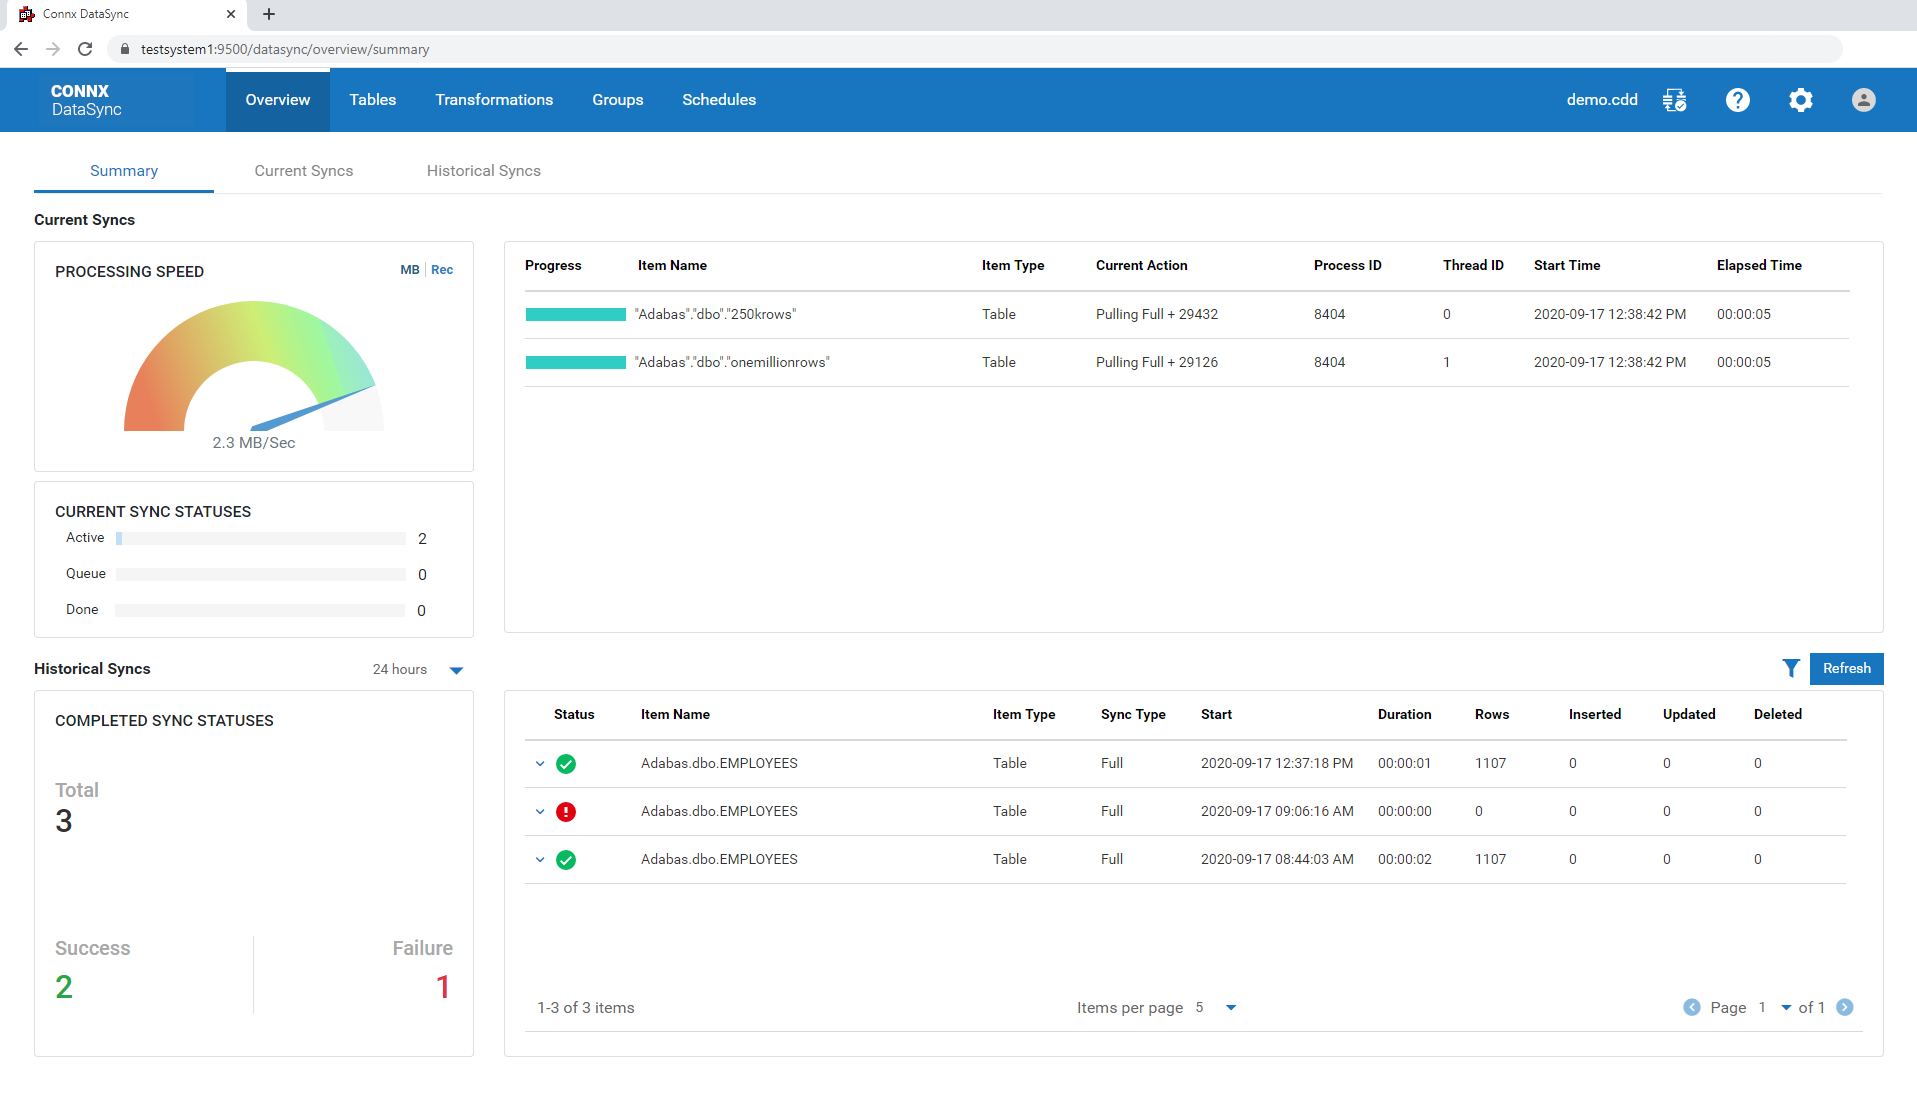
The Current Syncs section provides real time information for all synchronization tasks currently running. This section auto refreshes and always shows current information for the system.
Processing Speed
Processing Speed is represented by the speedometer graph and shows the overall speed of all running jobs in either megabytes
per second or records per second. The graph can be toggled between these two metrics by clicking either MB or Rec in the
upper right corner of the speedometer's display.
Current Sync Statuses
This section provides information on how many jobs are currently running, how many are queued waiting to run and have many
have finished.
Individual Progress of each running Job
The section to the right of Processing Speed and Current Sync Statuses shows statistics for each running job.
The Progress column provides a bar graph that indicates progress.
The Item Name column contains the name of the table, transform or group that is currently running
Current Action provides information about what DataSync is doing. For example, Pulling Full+29432 indicates that DataSync is performing a full reload of the target table and has retrieved 29432 records from the source. Other actions may be Analyzing, Inserting, Updating or Deleting.
Process ID displays the process ID or PID of the DataSync process that is performing the sync. The Summary screen shows information for all DataSync jobs in the system so if there are multiple scheduled syncs running along with on demand syncs, there may be several PIDs represented on the display.
Thread ID displays the thread ID within the process. Each table or transform will be synchronized in a separate thread. The maximum number of worker threads per process can be adjusted in Settings.
Start Time is a timestamp indicating when the synchronization task started
Elapsed Time displays how long the synchronization has been running. It is in the form hh:mm:ss
The Historical Syncs section provides a summary of the completed synchronization tasks as well as a table view showing the individual tasks and their statistics.
Control buttons
There are three control buttons above the information section in the lower half of the display. They are:
Time frame specification. This drop down box allows the time frame for historical data to be specified. Possible values are 24 hours, 1 week, 1 month, 1 year and all time
Search Filter
Pressing this button activates search fields for the Status, Item Name and Item Type fields. To filter the results in the list of historical synchronization tasks, enter a value in one or more of these search
fields. For example, entering the word EMPLOYEES in the Item Name search box will cause only those tasks that have the word EMPLOYEES in the Item Name to be displayed.
Refresh This button refreshes the lower portion of the display.
Completed Sync Statuses
Completed Sync Statuses are displayed in the lower left section of the display. This section shows the total number of sync
tasks that have been run in the time frame specified in the Time Frame drop down. It also shows the total number of Successful
tasks as well as the total number of tasks that failed with an error.
List of Historical Syncs
The lower right section contains a table list of the synchronization tasks that have run during the time frame specified in
the time frame drop down. For details about the information presented in this table, please refer to the Historical Syncs topic later in this section.