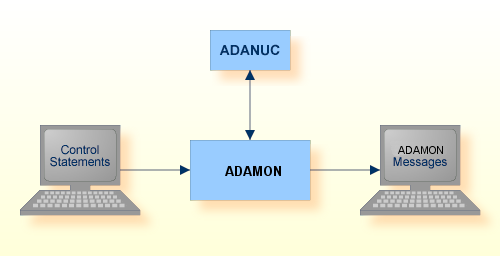
This document describes the utility "ADAMON".
Note:
This utility is not available on Windows platforms.
The following topics are covered:
The ADAMON utility is used to monitor an Adabas session with the aim of collecting performance data. The type of information collected is determined by the setting of the DISPLAY parameter; the information is usually displayed on a "per second" basis. The information collected can be presented as a set of numbers or as a basic graphical output. An ADAMON session is terminated by typing CTRL/C, or when the value specified for the LOOP parameter has been reached - then a statistical summary of the monitored session is displayed.
This utility is a multi-function utility.

| Data Set | Environment Variable/ Logical Name |
Storage Medium | Additional Information |
|---|---|---|---|
| Control statements | stdin/ SYS$INPUT |
Utilities Manual | |
| ADAMON messages |
stdout/ SYS$OUTPUT |
Messages and Codes |
The utility writes no checkpoints.
The following control parameters are available:
D    [NO]DATETIME

M    DBID = number

D    DISPLAY = keyword

D    [NO]GRAPHICAL

D    INTERVAL = number

D    LOOPS = number
[NO]DATETIME
If this parameter is set to DATETIME, each monitoring line with non-graphical output will be preceded by the current date and time. The default is NODATETIME.
DBID = number
This parameter selects the database to be used. The database must be active for all functions with the exception of DISPLAY = BACKUP.
DISPLAY = keyword
This parameter displays database information in accordance with the keyword specified. The display is refreshed at intervals specified by the parameter INTERVAL (default of 3 seconds). Please refer to the DISPLAY examples in the section ADAOPR for explanations of the information displayed.
The following keywords are available:
| Keyword | Meaning |
|---|---|
| ACTIVITY | Displays the throughput of a database, for example the number of commands per second. This keyword is the default if the nucleus is active. |
| BACKUP | Displays a graph which monitors the execution of an ADABCK DUMP or RESTORE function. The values displayed are normalized to full blocksizes, which can be different from the real backup/restore space because of 'used size compression'. The output is always graphically oriented. This keyword can also be used if the nucleus is not active. This keyword is the default if the nucleus is not active. |
| HIGH_WATER | Displays some important highwater values. The output is always graphically oriented. The bold line gives the current value in percent, the dashed line shows the highwater value. If there is only a bold line, the current and the high water values are identical. The 'Write Limit' line shows the number of modified blocks in percent until the flush limit is reached - at 100%, usually a buffer flush will be started. The number given within the line shows the modified space in bytes. The 'WP1 Flush' line shows the number of modified WORK part 1 blocks from the most recent buffer flush record - if the 100% point is reached, a buffer flush will be started. The 'Hit rate' lines show the overall hit rate (dashed line) and the current rate that occurred during the measured interval (bold line). The 'ASSO' and 'DATA' lines show the ratio between used and total allocated container space. The 'PLOG' line shows the ratio between the used and allocated space for the protection log. The numbers in these data set lines are either given in KB, MB or GB units. Note that the PLOG on file system always shows 100% |
| INDEX | Displays some counters and exceptions that occurred during index update (for internal reasons). |
| IO | Displays the number of physical I/Os of the specific Adabas container files, per second. For each container type (ASSO, DATA) only the first 10 extents can be displayed. I/Os to upper extents are collected in ASSOx or DATAx. |
Furthermore, if an exceptional situation is detected during collection of the data, additional information is displayed on the screen. In the non-graphical mode it is displayed in the final column, in the graphical mode, the status is shown in the base line. The following status information can be detected:
A buffer flush is in progress.
Threads waiting for work pool space on complex commands.
The nucleus is in ET_SYNC mode, which means no new transactions will be started.
The nucleus is executing a hyperexit.
The nucleus is executing a user exit.
The internal work pool is so large that it extends into the buffer pool.
Nucleus shutdown in progress.
Nucleus shutdown completed.
Nucleus abnormally terminated.
If an AUTORESTART is executing, ADAMON can monitor and display the phase number (1, 2, 3 or 4) and the number of processed blocks. Usually, phase 3 takes the most time, and the percentage of processed blocks is displayed. This is done independently of the selected function. When the AUTORESTART completes, it PT_RETs to the function requested.
[NO]GRAPHICAL
Setting this option to GRAPHICAL switches the output to the graphical format. For the display functions BACKUP and HIGH_WATER, only the graphical format is supported. The default is NOGRAPHICAL.
INTERVAL = number
This parameter specifies the data-collection sampling interval in seconds.
The default interval is 3 seconds.
LOOPS = number
This parameter limits the number of data collection loops.
By default, ADAMON loops continuously. Data collection can be terminated with CTRL/C.
adamon dbid=1
Display the activity of database 1.
adamon dbid=2
adamon display=high_water
Display the high-water marks of database 2.
adamon dbid=3
adamon display=io graphical
Display the I/O activity of database 3 with graphical output.
adamon dbid=4
adamon interval=10
Display the activity of database 4, and refresh the content of the screen every 10 seconds.