The appearance of tables in the content frame can be customized to meet the user's individual requirements or to suit the user's personal preferences. The width of the columns in a table can be adjusted. The position of the columns within a table can be changed. Where appropriate, the contents of tables can displayed in chart or graph form. The contents of all SMH tables can also be sorted alphabetically/ reverse alphabetically (text) or in ascending/ descending order (numbers).
Note:
This function requires an SVG viewer.
![]() To adjust the width of columns in a table
To adjust the width of columns in a table
In the table header move your mouse pointer to the double line
between two columns until the double-headed arrow (![]() )
appears and slide it back and forth until the desired width is reached.
)
appears and slide it back and forth until the desired width is reached.
![]() To change the positions of columns in a table
To change the positions of columns in a table
In the header of the column you wish to move, press and hold your mouse pointer.
Without releasing the mouse pointer, when the positioning arrows
(![]() )
appear, move the column to the desired position. Release the mouse pointer when
the column is in the position you wish.
)
appear, move the column to the desired position. Release the mouse pointer when
the column is in the position you wish.
![]() To display table information as charts
To display table information as charts
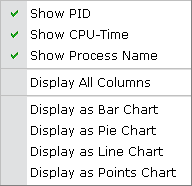
From the table heading, open the context menu.

Choose the desired format for the chart. Where appropriate, charts can be made in four forms: bar, pie, line or points chart. This option is not available for every table as the information in some tables cannot be presented in chart form.
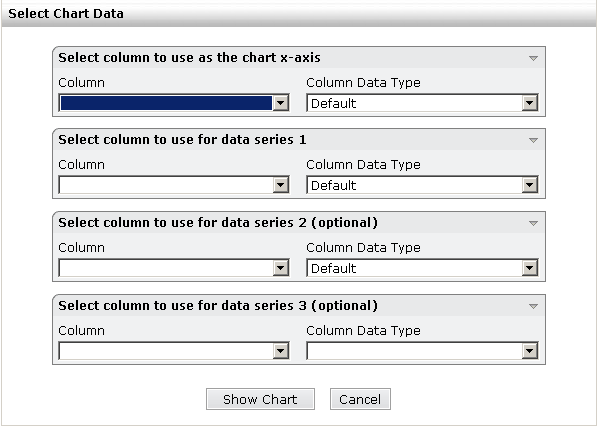
For bar, line and points chart types, a screen similar to the following is displayed:

Fill in the appropriate data and press to display the table in the desired chart format.
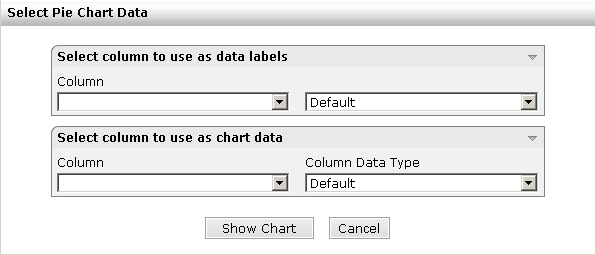
For pie charts, a screen similar to the following appears:

Fill in the appropriate data and press to display the table as a pie chart.
![]() To sort the information in a table
To sort the information in a table
Move your mouse pointer to the header of the column you wish to use
as sort criterion and press the sort icon (![]() ) near the right margin of
the column.
) near the right margin of
the column.
The contents of the table are re-arranged, based on the information in the active column.