This document covers the following topics:
MashZone is a browser-based application from Software AG which enables you to visualize any data from various, independently distributed data sources in a so-called MashApp.
Software AG provides sample MashApps for the infrastructure monitoring of selected enterprise product components. The MashApps show and evaluate data which is collected by Optimize for Infrastructure. They are showcases how a KPI-specific visualization can be achieved with MashZone.
Sample MashApps for the following product components are available for download:
Adabas Server
EntireX Broker
Natural Security
Natural zIIP Enabler
The following topics are covered below:
The MashApps and related data are provided in a zip file in Empower, as a download component for Optimize for Infrastructure. To download the zip file, proceed as follows:
Log in to Empower (https://empower.softwareag.com/).
Go to Products & Documentation > Download Components > Optimize for Infrastructure.
Download the "Infrastructure Monitoring MashApps" component (O4I_MashApps.zip).
In addition to the zip file, Empower also provides a readme file (Readme_O4I_MashApps.txt) which contains the latest update information.
You have to unpack the O4I_MashApps.zip file to the following directory, depending on the MashZone version that you are using:
For MashZone 9.0 and above:
<installation-directory>\server\bin\work\work_mashzone_<t>\mashzone_data
<t> indicates the type of the MashZone server. Types are s, m, and l. For example, work_mashzone_m for a medium type.
For MashZone versions lower than 9.0:
<installation-directory>
where <installation-directory> is the MashZone installation directory.
After unpacking the zip file, the following directories are available in the MashZone installation directory:
| Directory | Content |
|---|---|
| importexport\Optimize_<date> | MashApps for Optimize for Infrastructure. |
| resources\Optimize | Resources used by the MashApps. Initially, this directory contains the resources which do not have to be edited. |
| resources\Optimize_src | Source directory for resources which have to be edited (further information is provided below) and copied into the resources\Optimize directory. |
| assets\colorschemes | Color schemes. The color schemes for Optimize for Infrastructure are named O4I_*.xml. |
To adapt the MashApps to your requirements, you have to edit the resource files in the resources\Optimize_src directory as described below. The resource files are Excel files. To edit them, Microsoft Excel or any other tool which is able to handle Excel files is required.
The following resource files are provided:
Filter.xlsx
This file contains the instance filter definitions. Specify
one line for each filter/instance combination. A line is ignored if any entry
is empty.
In the Adabas Server MashApp, the filters with a
Product="Adabas Server" specification are listed in the
Filter selection box. If a specific filter is selected,
only the instances belonging to that filter are shown.
| Sheet | Column | Description |
|---|---|---|
| Filter | Filter | Specify the filter name. |
| Product | Specify the product component name. | |
| Instance | Specify the instance name.
For Adabas Cluster instances, specify the name of the server without nucleus specifications. |
Three Adabas servers are used in production:
00001 PROD-A
00002 PROD-B
00003 PROD-C
Two Adabas servers are related to project A:
00001 PROD-A
00011 TEST-A
In the Filter.xlsx file, you specify the following entries:
| Filter | Product | Instance |
|---|---|---|
| Production | Adabas Server | 00001 PROD-A |
| Production | Adabas Server | 00002 PROD-B |
| Production | Adabas Server | 00003 PROD-C |
| Project A | Adabas Server | 00001 PROD-A |
| Project A | Adabas Server | 00011 TEST-A |
In the Adabas Server MashApp, you will find the filter entries for "Production" and "Project A". If you select a filter, all Adabas Server charts will only show data for the Adabas servers which correspond to the selected filter. If you select "No filter", data for all Adabas servers is shown, even for those which are not referred to in any filter.
Products.xls
This file contains product component-specific settings. In
general, there is one sheet for each product component. On each sheet, you can
specify a value for each given property.
| Sheet | Property | Description |
|---|---|---|
| Adabas Server (MF) | Call Duration yellow |
The Adabas call duration is the average time in milliseconds that is needed for a database call. The lower the call duration, the better the database performance. Good, average and poor performance is indicated in the MashApp by a green, yellow or red colored background, respectively. Specify the value of the yellow threshold (in units of milliseconds) for which the call duration leaves the green zone. Default: 1. |
| Call Duration red | Specify the value of the red threshold (in units of milliseconds) for which the call duration leaves the yellow zone. Default: 5. | |
| Natural zIIP | NormFactor | Specify the CPU normalization factor of your z/OS machine. The default value is 1 which means that no normalization is used. |
Server.xls
This file contains the specification of the webMethods
Optimize server. If you use multiple servers, you have to specify one line for
each server. The delivered Server.xls file contains one
sample line for a locally running Analytic Engine. Remove this line if it is
not suitable for your environment.
| Sheet | Column | Description |
|---|---|---|
| URL | URL | Specify the URL and port for the MashZone access to the webMethods Optimize server. For Optimize version 9.0 or above, use the port of the Optimize Analytic Engine/WS Registry (default: 12503). Otherwise use the port of the Integration Server (default: 5555). |
| Integration Server | Specify "y" if an Integration Server is used. Otherwise specify "n". | |
| Description | Specify a descriptive name for the webMethods server. The descriptions are used in the Optimize Server selection of the MashApps. | |
| Enable | A server is only shown in the Optimize Server selection of the MashApps if "Enable" is set to "y". |
TimePeriod.xls
This file contains time-related information. Especially, it
is used to determine the time zone which is needed for the Optimize access from
MashZone.
| Sheet | Column | Description |
|---|---|---|
| Time Zone | My Location | Mark the line belonging to your location with an "X". |
Note:
The sample MashApp "Monitor EntireX Broker Calls
Sample" does not make use of the resource files.
To activate a MashApp, make sure you have a Professional, Enterprise or Event license file, that you have administrator rights, and then proceed as follows:
Copy all resource files from resources\Optimize_src to resources\Optimize.
Invoke MashZone.
Go to the Administration page (see the corresponding link at the top of the page) and then to the Import/Export/Delete page.
Import the MashZone archive files (*.mzp) from the importexport\Optimize_<date> directory using the Import function.
As an alternative, you can remove all files from the importexport directory, copy the files from the importexport\Optimize_<date> directory into the importexport directory, and then import the MashApps using the Import all function.
The MashApps in the importexport\Optimize_<date> directory are named as follows:
M_<MashApp name> <version>_<revision>_<date>-<time>.mzp
where the MashApp name can be one of the following:
| MashApp Name | Description |
|---|---|
| Monitor Adabas Server | Monitor Adabas Server (mainframe) KPIs. |
| Monitor EntireX Broker Calls Sample | MashApp sample which shows how to access Optimize for Infrastructure data from MashZone. The MashApp can be used as a template for monitoring Optimize for Infrastructure KPIs. Before you can use this sample, you have to edit the associated data feed "O4I Read EntireXCalls Sample" and adjust it to your needs. |
| Monitor EntireX Broker Calls | Monitor the distribution and history of EntireX Broker calls. The MashApp can be used as a template for monitoring Optimize for Infrastructure KPIs in a selected time range. |
| Monitor Natural Security | Monitor Natural Security KPIs. |
| Monitor Overview | Overview of the MashApps for the enterprise product components. |
| Monitor zIIP Enabler for Natural | Monitor zIIP Enabler for Natural KPIs and CP/zIIP utilization. |
After you have activated the MashApps as described above, you can open the MashApp "Monitor Overview". This MashApp provides links to all other infrastructure monitoring MashApps.
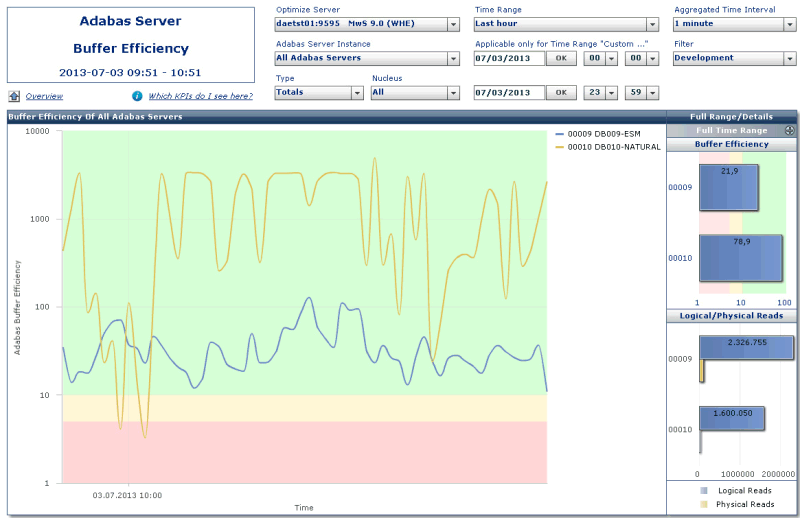
The following example shows the buffer efficiency history (last hour) of selected Adabas servers. If the buffer efficiency is monitored in short aggregated time intervals like one minute, it can be very high (higher than 10000). Nevertheless, the interesting values are those where the buffer efficiency is poor, which are the values lower than 10. The buffer efficiency-specific visualization in the MashApp uses a logarithmic chart so that peeks as well as critical values can be viewed appropriately.