Understanding the Service Stack
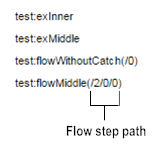
The Service Stack column shows the Java services and flow services called up to the point at which the exception occurred. The stack lists services in the following order:
For flow services, the Service Stack column also shows an indexed path that identifies the step within a service at which the exception occurred. The path takes the form /n/n/n..., where n represents a sequential index of flow steps and / indicates a level of nesting:
This path helps pinpoint the step at which the exception occurred and is particularly useful when a flow service is called multiple times or when the service or step is deeply nested. For example, suppose serviceA invokes serviceB three times, and the exception occurred at the second invocation of serviceB. The Service Stack column in the error log would show the path as serviceA(/1/2):
Step | Index |
INVOKE serviceB | /0 |
SEQUENCE | /1 |
| INVOKE serviceD | /1/0 |
| INVOKE serviceE | /1/1 |
| INVOKE serviceB | /1/2 (exception thrown here) |
SEQUENCE | /2 |
| INVOKE serviceC | /2/0 |
| INVOKE serviceB | /2/1 |


