Software AG's Tamino XML Server represents a fast, flexible, and highly scalable DBMS system. However, when writing high-performance, large-scale Tamino applications the first step to finding potential bottlenecks is to discover where an application spends most of its time.
The user may request the TaminoX ActiveX control
to output performance measurements. This causes the performance measuring code
paths to be enabled. The performance measurements help to identify where the
API and/or the Tamino XML Server spend most of the time. The performance
measurements can be requested without requiring changes to the applications
that make use of the TaminoX ActiveX
control.
The following table details the performance measurements that the
TaminoX ActiveX control can provide.
TotalOperationDuration |
The time taken from
operation start until operation end. It is the total processing time within the
API including XmlParseDuration and
TotalCommunicationDuration.
|
|---|---|
TotalCommunicationDuration |
The time taken from
sending the request to Tamino until the response document is completely
received. Note that this includes
TaminoServerDuration.
|
TaminoServerDuration |
The time taken for processing the request in the Tamino XML Server. |
TotalOperationDuration and
TotalCommunicationDuration are provided for all
operations involving communication with the Tamino XML Server.
TaminoServerDuration can only be provided for
operations that receive a response document back from the Tamino XML Server. In
contrast to other Tamino APIs no XmlParseDuration
value is available as it is not possible to provide such a value from the
TaminoX ActiveX control due to its implementation.
To request the performance measurements the user must set environment
variable SAG_TAMINOX_PERFORMANCE to a non-empty
value. The environment variable must be in the environment of the
TaminoX ActiveX control for the performance logging to
take place (i.e. it must be set before the application is started). The
performance log file will be created in the following fashion:
If %TEMP% is set then use this
directory.
If %TMP% is set then use this
directory.
Otherwise create the performance log in the current working directory.
Note that the environmental variables would have to be SYSTEM values in the case of system services (e.g. an ISAPI filter). The performance log file will have the name SAGTaminoXPerf###.cvs – where ### is the process id number.
The following screen is the output produced when running the
TamXPerformance executable shipped as
samplePerformance. In a Windows command console set the
environmental variable SAG_TAMINOX_PERFORMANCE and
then run the TamXPerformance executable. Use the
button to set the Tamino XML Server URL. Then
run the example method calls by choosing the
button. The TaminoX methods that will be executed
are:
Process
XQuery
DeleteByQuery
A performance file is generated.
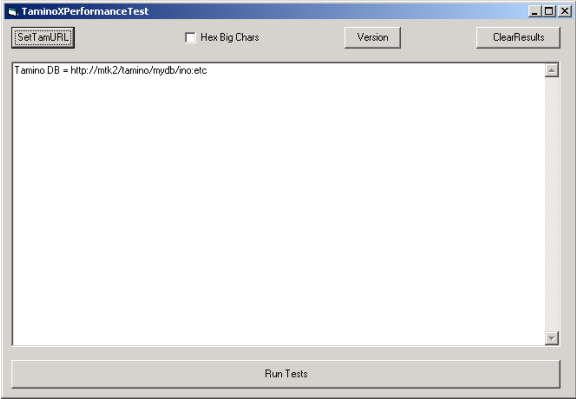
The following window shows the output before any tests have been run:
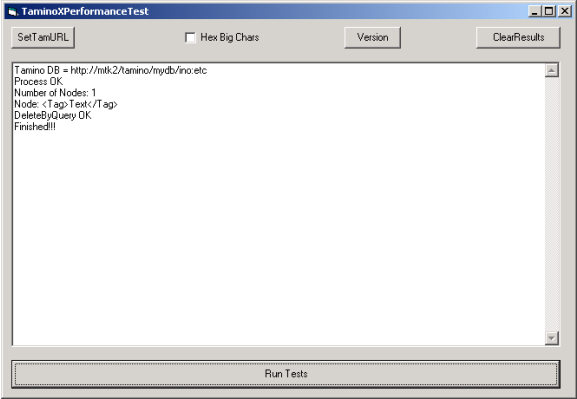
The following window shows the output after a set of tests have been run.
The performance log file will be a comma separated data file suitable as input to spreadsheet applications. The columns that are output are the following:
| Column | Description |
|---|---|
| CurrentTime | Current system time at start of command execution. |
| Command | The API method being measured. |
| Data | Data for the command. |
| URL | URL of command if
different to csDatabaseURL, otherwise an empty
string.
|
| TotalOperationDuration | As described in Measurements. |
| TotalCommunicationDuration | As described in Measurements. |
| TaminoServerDuration | As described in Measurements. |
Note that all times are in milliseconds. The times that are produced are to be taken as being indicative rather than absolute. The times should generally be reasonably accurate but the sum of individual durations may differ from the total operation duration due to measurements occurring in different processes and possibly on different machines.
The following is what may be generated by a run of the TamXPerformance sample executable:
"CurrentTime(ms)","Command","Data","URL","TotalOperationDuration(ms)","TotalCommunicationDuration(ms)","TaminoServerDuration(ms)"
12694957353297,"Diagnose","","http://localhost/tamino/mydb/ino:etc?_diagnose=version",420.0,220.0,0.0
12694957358184,"Process","","",871.0,861.0,832.0
12694957358235,"XQuery","_xquery=input()/XPerfDoc/Tag","",30.0,20.0,10.0
12694957359026,"DeleteByQuery","_delete=XPerfDoc","",781.0,781.0,0.0