Displaying a List of Monitored Components

To display a list of Monitored components
1. In My webMethods: Navigate > Applications > Administration > Analytics > Infrastructure Components > Monitored Components
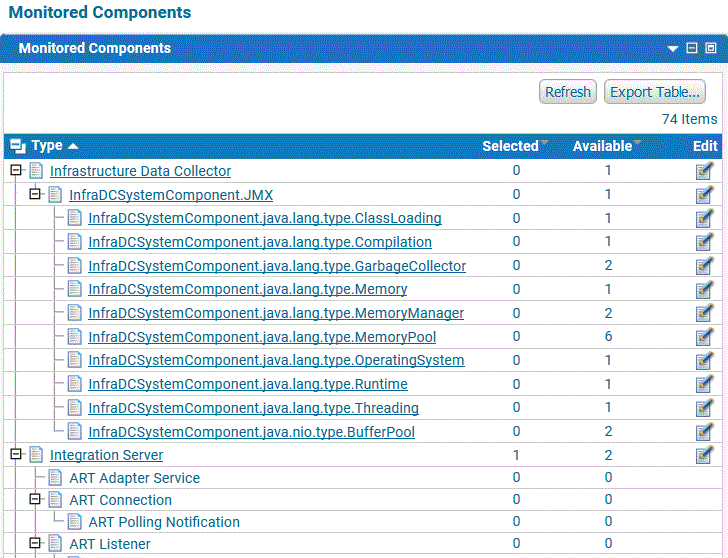
The Monitored Components page is displayed.
You can do the following from the Monitored Components page:

Click

to expand the hierarchical tree to view all children.

Click the name of a component type, or click

, to edit the components and KPIs selected for this component type.

Click

beside a column heading to sort the display by the information in the column.
The Components table provides information about the available monitored components, as described in the following table.
Column | Description |
TYPE | Monitored component type. If assets have been discovered for this component type, the number of discovered assets of this type appears in the Available column, and the component type is editable. Click the name of the component type, or the Edit  icon, to change the selected component instances or KPIs associated with this component type. Click  to view children of the component type. |
SELECTED | Number of components of this type selected. |
AVAILABLE | Number of components of this type available for selection. |
ACTIONS | Contains an Edit  icon for each monitored component. This icon is unavailable for components types of which no assets have yet been discovered. |
The following table describes the controls.
Control | Description |
 Edit Edit | Click to edit the associated component in the Edit Monitored Component page. (You can also click the name of the component to display the Edit Monitored Component page.) |
Export Table | Click to display the contents of the Components table as a .csv file. |

 to expand the hierarchical tree to view all children.
 to view children of the component type.