Component | Description |
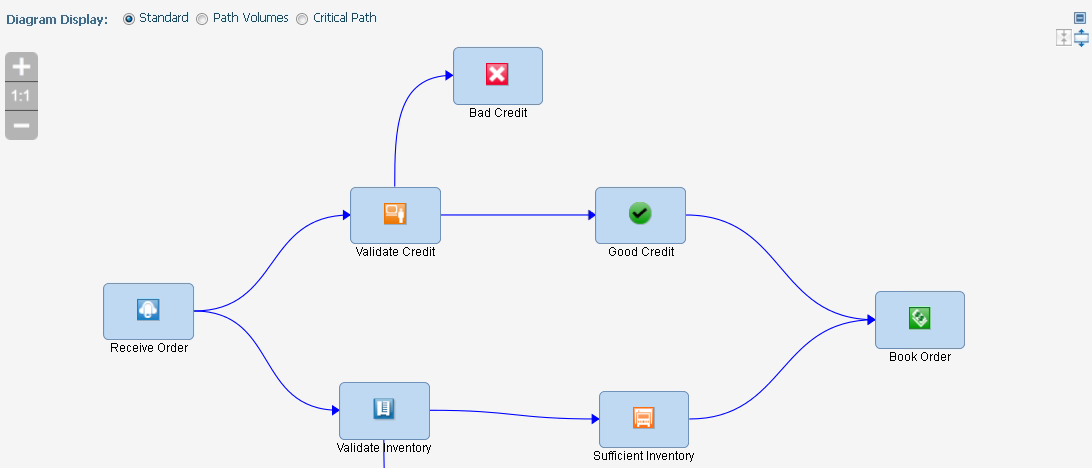
Zoom control Plus (+) button Minus (,) button 1:1 button | Adjusts the size of the process diagram.  Zooms in to view details of the process. Each click enlarges the size of the process diagram 20 percent. Zooms out to view a larger portion of the process. Each click reduces the size of the process diagram by 20 percent. Returns the default size of the process diagram. Note: The scroll wheel on the mouse also zooms in and out. Note: The process diagram height that you configure is stored for the current user. |
Diagram area | Displays a diagram of the whole business process or a portion of the business process. For information about the components of the business process shown in the diagram area, see
Understanding Business Process Models. For information about the view-specific components of the business process shown in the diagram area, see the following table. |
Annotation | Description |
 selected step | Indicates that the step is selected. |
 container minimize | Minimizes a subprocess container. For more information, see
Containers. |
container icon | Represents a subprocess container that has been minimized. Double-click the icon to expand the container. Note: For nested containers, minimizing a container also minimizes all containers nested in it. |
Referenced process | Represents a referenced process. For more information, see
Referenced Process. |
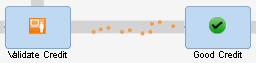 swarm line  swarm line colors | Indicates the volume of the process instances that are executed between the business process steps. The color of the swarm line dots indicates the relative volume of process instances. Use the swarm line colors for volume reference. |