Understanding Business Process Models
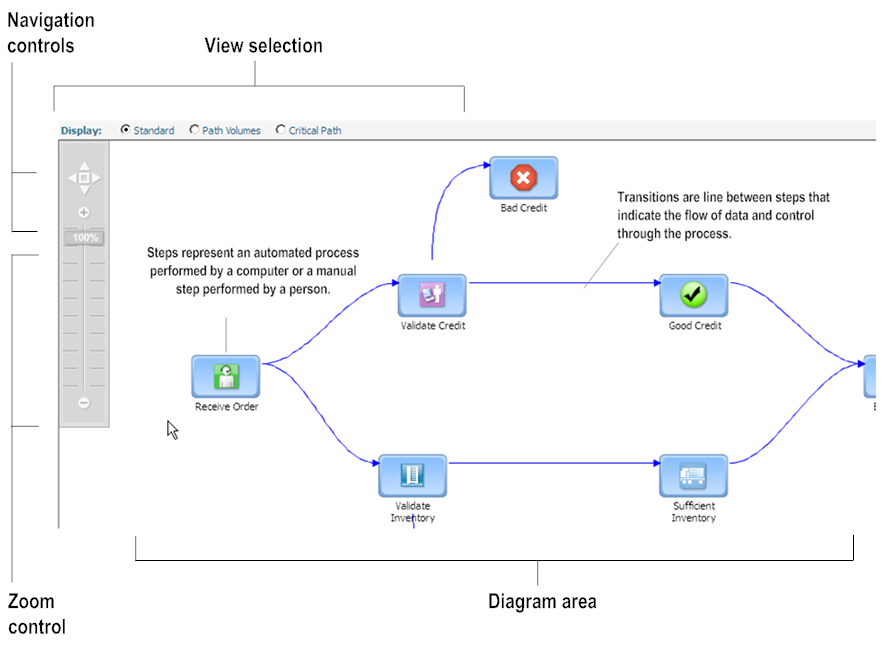
The Process Analytics page displays a visual overview diagram or model of an entire business process. Business process models are created in Software AG Designer. The following figure shows a sample business process model on the Process Analytics page.
Figure 7. Sample business process model
A business process model consists of:

Steps
Transitions
Pools (optional)
Swimlanes (optional)
Subprocesses (optional)
Containers (optional)
Referenced processes (optional)
The following right-click options are available in the Process Model diagram area of all Process Analytics pages.
Fit to screen - Resizes and re-centers the diagram based on the screen size.
Hide transition labels - Hides description and expression text on all transition lines in the diagram.
Show transition descriptions - Shows all applicable description text created in
Designerfor all transitions on the diagram.
Show transition expressions - Shows applicable transition expressions created in
Designerfor all transitions on the diagram.
Truncate transition expressions/descriptions label - Shortens description and expression text on all transition lines in the diagram.
Expand transition expressions/descriptions label - Expands description and expression text on all transition lines in the diagram to their full length.