
This document introduces EntireX Mainframe Broker Monitoring and describes a sample scenario. It covers the following topics:
This feature is described in more detail under EntireX Mainframe Broker Monitoring using the Command Central GUI | Command Line in the platform-independent Administration documentation.
EntireX Mainframe Broker Monitoring is a package with which you can monitor EntireX Broker on mainframe platforms z/OS and BS2000. Define an instance of your mainframe broker, using Command Central under UNIX or Windows. This instance - a so-called proxy - holds connection information to the remote broker. With the Mainframe Broker Monitoring package you can:
directly recognize whether the Broker is online
see whether the KPIs are in a range expected by your organization
switch to the Administration page to list the registered services and server
check directly whether more server instances are needed.
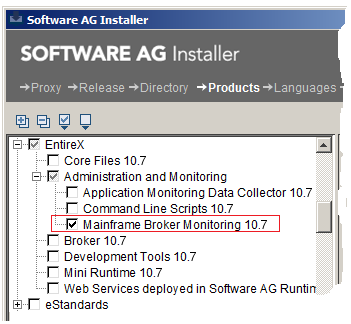
In the Software AG Installer, choose > and check .
For more information see
EntireX Administration and Monitoring under EntireX Installation Packages in the General Installation documentation
Using the Software AG Installer under Cross-Product Guides > Software AG Installer and Update Manager Using the Software AG Installer> in the Software AG Documentation.
See Installing, Configuring, and Upgrading Command Central in the Command Central documentation.
To monitor a mainframe broker, you need to define a proxy instance in Command Central.
 To create an instance for EntireX Mainframe Broker Monitoring
Log on to Command Central and navigate to Home > Instances > ALL > EntireX Mainframe Administration.
Click the Configuration tab.
Add connection information.
The new proxy instance of your mainframe broker now appears in the list of instances.
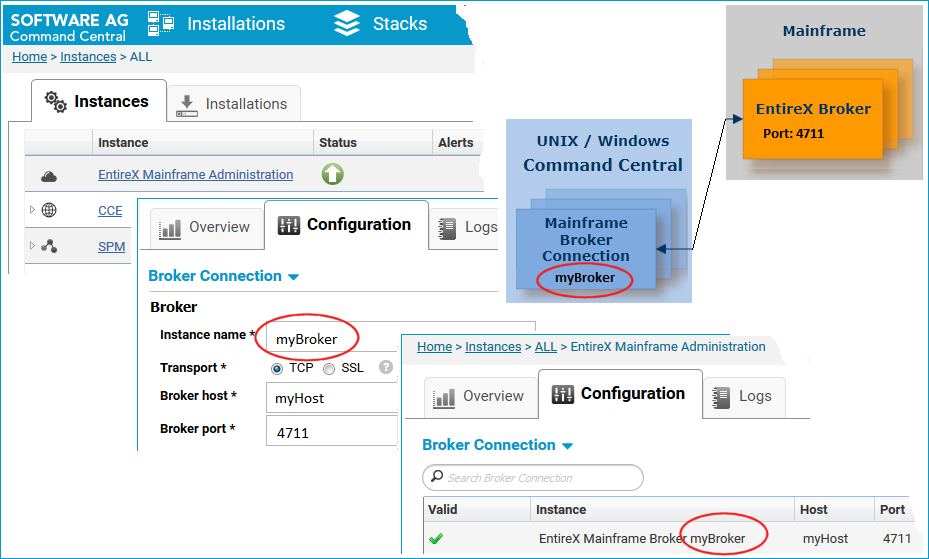
All options are described in more detail under Creating an EntireX Mainframe Broker Connection in the platform-independent Administration documentation.
Note:
You can also create a connection to a mainframe broker using the Command Central command line. More info
To monitor your mainframe broker
In Command Central, navigate to > > .
The instance myBroker you created in the previous step is displayed as EntireX Mainframe Broker myBroker.
Click on this instance, select the Overview Tab to watch the following:
the status of the instance (online or stopped)
alerts
the following KPIs:
active clients
registered servers
ongoing conversations between them.
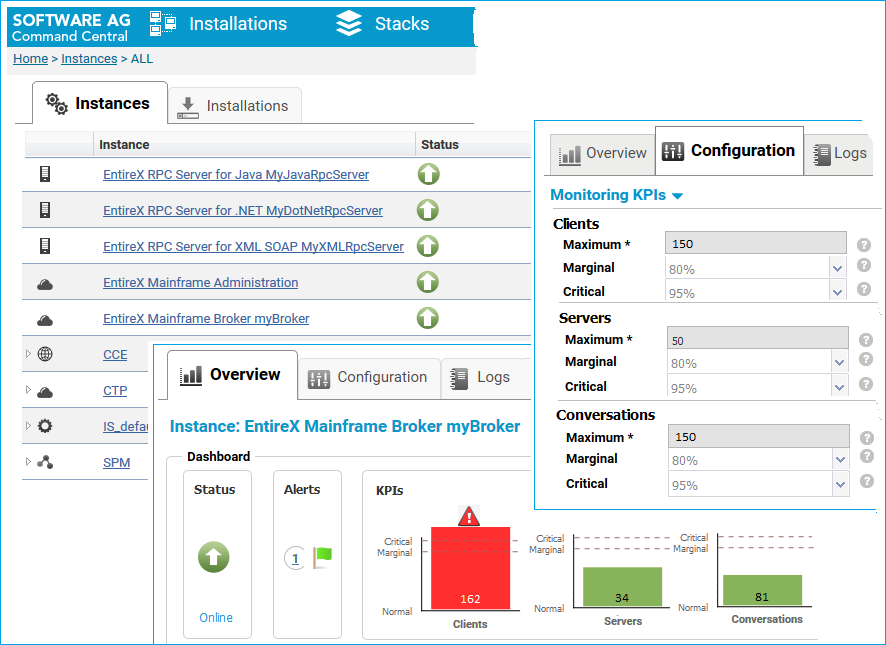
On the Configuration tab, choose Monitoring KPIs to adjust scaling and boundary values (maximal/marginal/critical) for the KPIs, clients, servers and conversations.
If a defined boundary value is crossed, the color changes to direct your attention to the KPI:
orange: a marginal line is crossed
red: a critical boundary value is exceeded.
If required, from the Configuration tab, choose Broker Connection to modify the connection parameters to your EntireX mainframe broker.
All options are described in more detail under Configuring an EntireX Mainframe Broker Connection in the platform-independent Administration documentation.
Note:
You can also configure your connection to a mainframe broker using the Command Central command line. More info
To view your registered services and servers
Navigate to your instance EntireX Mainframe Broker myBroker.
Use the Administration tab for an overview of services currently running.
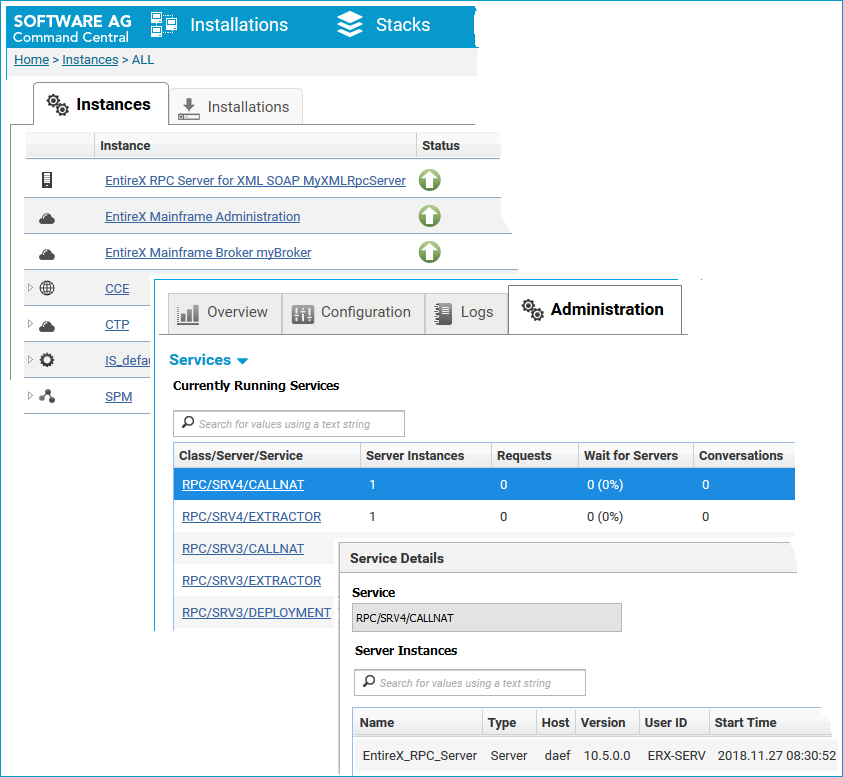
Watch the number of active Server Instances (replicates), Requests, Wait for Servers and Conversations for a service.
Of particular interest is the column Wait for Servers. This tells you the number and percentage of requests where clients had to wait because all running server instances were busy. Consider starting more server instances if those values are high.
See also Displaying Services and Servers in the platform-independent Administration documentation.
Note:
You can list server instances and running services using the Command Central command line. More info