
This document covers the following topics:
EntireX Broker and/or the EntireX Adapter serve as the central components which control the data flow. Their configuration defines the following:
whether application monitoring is enabled or disabled
the services that are used for monitoring (only for EntireX Broker), see Fine-tuning Application Monitoring for Selected Services
the Application Monitoring Data Collector to which the measuring data is sent.
RPC client and RPC server applications (see Components that Support Application Monitoring) automatically support Application Monitoring without additional setup. This includes EntireX RPC Connection and EntireX RPC Listener Connection of the EntireX Adapter, which are used together with an EntireX Broker as the central component. See Dynamic Configuration and Setup for EntireX Adapter.
The Application Monitoring Data Collector inside the EntireX Adapter and the External Application Monitoring Data Collector are interchangeable. You can use the Data Collector inside the EntireX Adapter for scenarios with the EntireX Broker and equally, the External Application Monitoring Data Collector for scenarios with the webMethods Integration Server.
Whatever architecture you choose, you can configure Application Monitoring dynamically while the EntireX Adapter or EntireX Broker is running. The change is effective immediately, and you do not need to restart the EntireX Adapter or EntireX Broker. This section covers the following topics:
This setup applies to the following connection types:
EntireX Direct RPC Connection
EntireX Direct RPC Listener Connection
IMS Connect Connection
CICS IPIC Connection
CICS ECI Connection
CICS Socket Listener Connection
AS/400 Connection
Note:
If you are using an EntireX RPC Connection or EntireX RPC Listener Connection, you need to enable Application Monitoring in
the EntireX Broker to which the connection is made.
See Dynamic Configuration and Setup for EntireX Broker.
You can choose an Internal Application Monitoring Data Collector (recommended) or an External Collector.
 To configure the Internal Application Monitoring Data Collector in EntireX Adapter dynamically
In the webMethods IS Administration GUI, choose > > .
Enable Application Monitoring.
Enable Use internal Application Monitoring Data Collector.
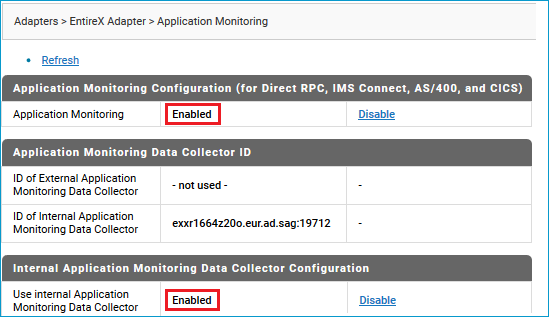
The collector runs as a server in the Direct RPC component and is started and stopped automatically when the Direct RPC component is started or stopped.
External Collector
Alternatively, the monitoring KPIs can be routed to an External Application Monitoring Data Collector, using either
a collector running internally within Direct RPC in a different instance of Integration Server, or
a collector pre-started as a service, as described under Setting up the External Application Monitoring Data Collector
Configuring the External Application Monitoring Data Collector in EntireX Broker scenarios depends on the platform the broker is running on. You can also fine-tune Application Monitoring for selected services. This section covers the following topics:
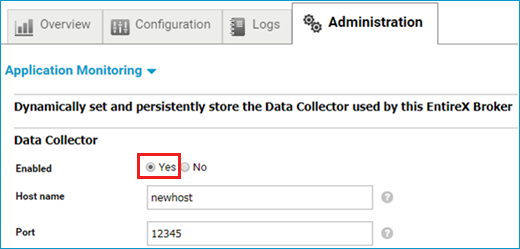
Use the Command Central GUI or command-line interface:
GUI
Choose > and enable Data Collector.
See Changing the Application Monitoring Settings Dynamically under Administering EntireX Broker using the Command Central GUI.
Command Line
See Changing the Application Monitoring Settings Dynamically under Administering EntireX Broker using the Command Central Command Line.
Define the endpoint for the External Data Collector in the broker attribute file,
see Application Monitoring-specific Attributes in the platform-independent Administration documentation.
You can then enable and disable application monitoring dynamically, see Application Monitoring-specific Commands in the z/OS Administration documentation.
To permanently enable application monitoring, set APPLICATION-MONITORING=YES under Broker-specific Broker Attributes.
Using specific attributes in the broker attribute file, the broker can be configured to enable application monitoring for selected services. Configuration example:
DEFAULTS = BROKER
  APPLICATION-MONITORING = YES
DEFAULTS = APPLICATION-MONITORING
  COLLECTOR-BROKER-ID = server12:57900
DEFAULTS = SERVICE
  APPLICATION-MONITORING-NAME = Payroll_Application
  CLASS = RPC, SERVER = HR, SERVICE = CALLNAT, APPLICATION-MONITORING = YES, APPLICATION-MONITORING-NAME = HR_Application
  CLASS = RPC, SERVER = *, SERVICE = CALLNAT, APPLICATION-MONITORING = YES
With this example configuration, application monitoring is enabled for all RPC/*/CALLNAT services. The service RPC/HR/CALLNAT uses the application monitoring name "HR_Application", all other services use the name "Payroll_Application". The Application Monitoring Data Collector runs on a host with the name "server12" and uses the port 57900.
Notes:
the broker if the automatic update mode of the broker is switched off, see SERVICE-UPDATES=NO under Broker-specific Attributes in the Platform-independent Administration documentation
all involved RPC servers in any case.
This section covers the following topics:
The configuration file entirex.appmondc.properties controls the startup of the Application Monitoring Data Collector. It is located in the config directory of your EntireX installation.
As a rule, it is not necessary to change the settings in this file after the installation. However, if required, you can change the following parameters:
| Parameter | Description |
|---|---|
entirex.appmondc.port |
The TCP/IP port on which the Application Monitoring Data Collector accepts the monitoring data. This value is set during the installation of the Application Monitoring Data Collector. |
entirex.appmondc.directory |
The name of the directory which will contain the
CSV data files. The default value is
<EntireX-install-dir>/appmondc/.
A data file has the name appmon<YYYYMMDD>.<HHMMSS>.csv. In addition, an overview file with the name appmon.overview.v1.csv is created. |
entirex.appmondc.loglevel |
The log level for the log files. Possible values are:
The default value is Log files are always stored in the directory
<EntireX-install-dir>/appmondc/. This is independent
of the setting of the |
entirex.appmondc.maxlines |
The maximum number of rows per CSV data file. If the limit is reached, a new file is created. The default value is 100000. |
entirex.appmondc.filesperday |
Automatically create a new CSV data file every
day. The default value is no.
|
entirex.appmondc.usezeroasnullvalue |
Use "0" instead of an
empty entry as the null value for all numeric KPI values in the CSV file. The
default value is no.
|
entirex.appmondc.callback.class |
Java class name for the callback user exit. |
entirex.appmondc.callback.classpath |
Classpath name in URL notation for the callback user exit. |
This section covers the following topics:
The scripts mentioned below are located in the bin directory of your EntireX installation. By default, this is /opt/softwareag/entirex/bin.
To start the Application Monitoring Data Collector
Run the script appmondc.bsh from a shell.
To stop the Application Monitoring Data Collector
Run the script stopappmondc.bsh from a shell.
The Application Monitoring Data Collector is installed as an application and as a Windows service. During the installation, you can specify that the Windows service is to be started automatically. The name of this service is "Software AG EntireX Application Monitoring Data Collector 10.9".
Note:
You can access the list of services by opening the Start menu and
then entering "services.msc" in the search box.
There, you can start and stop the service manually.
To start the Application Monitoring Data Collector as an application
Choose the following from the Windows Start menu:
Or:
Run the script appmondc.bat which is located in
the bin directory of your EntireX installation.
To stop the Application Monitoring Data Collector (service and application)
Choose the following from the Windows Start menu:
Or:
Run the script stopappmondc.bat, which is
located in the bin directory of your EntireX installation.
The Application Monitoring Data Collector provides a callback functionality for the processing of incoming events. A user exit can be specified to implement the callback. Whenever the Data Collector receives a monitoring event, the KPI values are writen to the CSV file and the callback is invoked. The KPI values of the event are passed to the callback. Possible use cases are:
trigger an action based on specific KPI values (e.g. the KPIs indicate a failed request)
write the KPI values to another data store or in a format that is different from a CSV file
To enable the user exit callback, use the property
entirex.appmondc.callback.class to specify the
class name of the user exit implementation. The class is loaded using the
standard classpath. You can specify a separate classpath with the property
entirex.appmondc.callback.classpath. Note that for
the classpath, a file or HTTP URL must be specified (on Windows replace the "\"
character with "/"). Your user exit class must implement the Java interface
com.softwareag.entirex.appmondc.DataCollectorCallback.
This Java interface has the following methods:
/**
 * Initialize the callback handler.
 * @param directory The name of the directory that will contain the CSV data files (set by property "entirex.appmondc.directory")
 *
 * @throws Exception
 */
public void start(String directory) throws Exception;
/**
 * Stop the callback handler.
 */
public void stop();
/**
 * Process an event. This corresponds to an entry in the CSV file.
 * The map contains all KPIs which have a value.
 * The key names of the map are identical to the KPI names.
 *
 * @param kpis The KPI map.
 * @throws Exception
 */
public void processEvent(Map<String, String> kpis) throws Exception;