This document covers the following Command Central topics that are specific to EntireX:
See also Administering EntireX Broker using the Command Central GUI | Command Line.
Note:
Command Central functionality that is not EntireX-specific is described in the separate Command Central documentation or the
online help provided with Command Central. On Empower, the documentation is provided under
webMethods > EntireX > EntireX 10.5 > Additional Documentation.
This section applies to Broker instances running on UNIX and Windows platforms. Since EntireX 10.3 you can also administer EntireX Brokers running on mainframe platforms. See Introduction to Monitoring EntireX Mainframe Broker using Command Central.
For EntireX, you can use Command Central to perform the following operations on EntireX Broker:
View the EntireX Brokers running in each environment of your IT landscape
View the versions of EntireX Brokers
Monitor EntireX Broker installations
Monitor runtime status, KPIs (key performance indicators), and alerts of EntireX Broker instances
Start, stop, and restart EntireX Broker
Configure the following parameters of EntireX Broker:
Application Monitoring
Attribute File
Autostart
Monitoring KPIs
Persistent Store
SSL Ports
TCP Ports
Security
Trace
Enable and specify EntireX Broker Trace Level temporarily
Display Services
Stop Service
Display Server Instances of a Service
Stop Server Instance
Create new EntireX Brokers
Delete existing EntireX Brokers
Note:
Software AG Platform Manager (installed by default with Command Central) uses
EntireX Broker Admin to obtain information about EntireX Brokers, so EntireX Broker Admin must be
running if you want to administer EntireX Brokers through Command Central.
For more information see the separate Command Central documentation or the online help provided with Command Central.
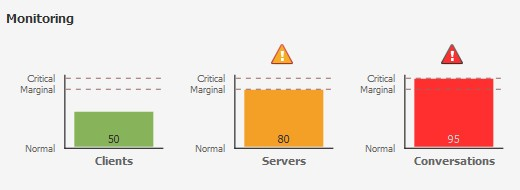
The visual key performance indicators (KPIs) and alerts enable you to monitor webMethods EntireX Broker's health. The following KPIs help you administer, troubleshoot, and resolve performance issues in EntireX Broker:

| KPI | Description |
|---|---|
| Clients | Number of active clients. |
| Servers | Number of active servers. |
| Conversations | Number of active conversations. |
The EntireX Broker component supports the configuration instances listed in the following table.
| Instance | Type | Use to... |
|---|---|---|
APPLICATION-MONITORING |
APPLICATION-MONITORING |
Configure Application Monitoring. |
ATTRIBUTE-FILE |
ATTRIBUTE-FILE |
Show and edit the EntireX Broker Attribute file. |
BROKER-AUTOSTART |
BROKER-AUTOSTART |
The autostart value of an EntireX Broker instance determines whether it will be started when the computer is restarted. |
SSL |
BROKER-PORTS |
Show and edit the EntireX Broker SSL Transport parameters. |
TCP |
BROKER-PORTS |
Show and edit the EntireX Broker TCP Transport parameters. |
BROKER-PSTORE |
BROKER-PSTORE |
Define how unit-of-work messages are stored to disk. |
BROKER-SECURITY |
BROKER-SECURITY |
Enable or disable EntireX Broker security. |
BROKER-TRACELEVEL |
BROKER-TRACELEVEL |
Show and edit the EntireX Broker Trace Level. |
EXX-MONITORING-KPIS |
EXX-MONITORING-KPIS |
Show and edit the Monitoring KPI settings, like the marginal and critical bounds, etc. |
Note:
The default SSL Port configuration uses default certificates provided with the installation, but we strongly recommend you
create your own. This means, however, that you may provide an incorrect certificate in the Command Central graphical user
interface.
This has the effect that the Monitoring KPIs are not presented correctly and the original communication exception cannot be
shown in the GUI.
However, the original exception is available in the wrapper.log of the SPM profile.
Look for the string pattern "cannot get KPIs! RpcException 0013" in the log file and check the EntireX Error Messages and Codes for the original RpcException.