Monitoring Terracotta
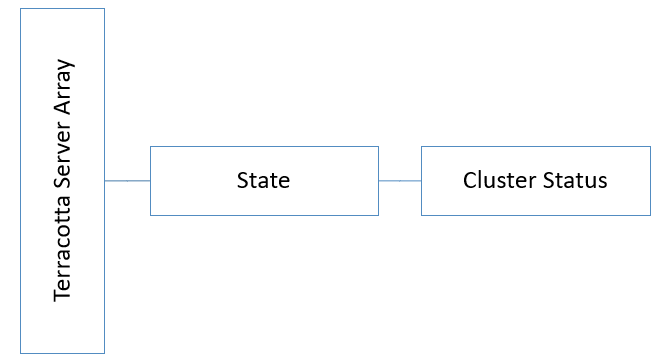
As part of application monitoring, you can monitor the state, that is the cluster status of Terracotta Server Array.
How do I set up probes to monitor the health of Terracotta Server Array?
Set up Liveness Probe - Node Level
To monitor the liveness of Terracotta server, that is to check the cluster health status of Terracotta to know if it is healthy and responding, run the following script:
SAGInstallDirectory/Terracotta/server/bin/server-stat.sh
Check the following condition from the response to verify the liveness of the server .
<server>.health = OK
AND
<server>.role = ACTIVE/PASSIVE
Following is one of the responses based on which Terracotta instance, the health check is done:
server.health: OK
server.role: ACTIVE
server.initialState: START-STATE
server.state: ACTIVE-COORDINATOR
server.port: 9540
server.group name: TSA API Gateway
or
server.health: OK
server.role: PASSIVE
server.initialState: START-STATE
server.state: PASSIVE-STANDBY
server.port: 9540
server.group name: TSA API Gateway
If you get a
200 OK response, liveness check is successful. If the result of the above health check does not return 200 OK, it implies that liveness check failed and denotes a problem. The response JSON indicates the problem. However, there can be other errors like
timeout and
no response as the request didn't reach the probe. Several factors can contribute to the delay when the liveness probe initiates, which may result in the timeout errors. See
Causes for timeout errors for more information.
If the Liveness check fails, restart Terracotta server.
Set up Readiness Probe - Node Level
To monitor the readiness of Terracotta server, that is to check if Terracotta is ready to serve the requests, use the same script that is mentioned for the liveness check and monitor the readiness with the same condition.
If you get a
200 OK response, readiness check is successful. If the result of the above health check does not return 200 OK, it implies that readiness check failed and denotes a problem. The response JSON indicates the problem. However, there can be other errors like
timeout and
no response as the request did not reach the probe. Several factors can contribute to the delay when the liveness probe initiates, which may result in the timeout errors. See
Causes for timeout errors for more information.
Infrastructure Metrics
Infrastructure metrics include system metrics and container metrics. For information about container metrics, see
Container Metrics.
System Metrics
It is important to monitor the following system metrics for an optimal performance of Terracotta server.

CPU usage

Disk usage

Memory usage
You can monitor the system parameters using the following metrics. If the metrics return an exceeded threshold value, you can consider the severity as mentioned below and perform the possible actions that Software AG recommends to identify and debug the problem and contact Software AG for further support.
Note:
The threshold values, configurations, and severities that are mentioned throughout this section are the guidelines that Software AG suggests for an optimal performance of Terracotta server. You can modify these thresholds or define actions based on your operational requirements.
To generate thread dump and heap dump for monitoring various system metrics:
Monitor the CPU usage
If the CPU usage of the system is above the recommended threshold value, you can consider the severity as mentioned and perform the possible actions listed to identify the reason.
CPU usage: Above 80% threshold for 15 minutes continuously, Severity: WARNING
CPU usage: Above 90% threshold for 15 minutes continuously, Severity: CRITICAL
Following are the guidelines to identify the reason for higher CPU usage:
1. Identify the process that consumes the highest CPU.
2. Generate the thread dump.
3. Analyze the thread dump and logs to identify the problem.
4. Monitor the process closely. If the process fails, it should recreate.
5. Check if the active-passive quorum is intact using the following script SAGInstallDirectory/Terracotta/server/bin/server-stat.sh
6. Check if the API Gateway clients can establish the connection to Terracotta cluster using the following REST endpoint GET /rest/apigateway/health/engine.
Monitor the Disk usage
If the disk usage of the system shows a higher value, rotate logs based on a fixed size and fix the number of rotated files to be persisted
Monitor the Memory usage
If the memory usage is above the recommended threshold value, you can consider the severity as mentioned and perform the possible actions listed to identify the reason.
Memory usage: Above 80% threshold, Severity: WARNING
Memory usage: Above 90% threshold, Severity: CRITICAL
Following are the guidelines to identify the reason for higher memory usage:

Identify the process that consumes more memory.

Start the
Terracotta Management Console ( TMC ) and check the heap usage, off-heap usage and warnings.

Analyze the memory dump and
Terracotta logs to identify the issue.

Monitor the process closely.

Check if the active-passive quorum is intact using the following script
SAGInstallDirectory/Terracotta/server/bin/server-stat.sh 
Check if the
API Gateway clients can establish the connection to
Terracotta cluster using the following REST endpoint
GET /rest/apigateway/health/engine
