Node-level Monitoring
The node-level monitoring ensures the availability of every instance of API Gateway component in the node. It checks whether a particular instance (application) of API Gateway in the node is ready to serve the requests. The node health is monitored by setting up probes per instance of each component in the node.
The node-health monitoring enables you to check the following during the application start-up:

If the bootstrap of the node is completed.
If the node joined the cluster.
If the node is ready to serve the requests.
If the node is unhealthy, it identifies the problem and checks if the server component requires a restart.
The node-health monitoring enables you to check the following when the application in the node runs:
If the node is available.
If it the node is under load.
If the node is performing well.
If there are any errors.
If the node is unhealthy, it identifies the problem and checks if the server component requires a restart.
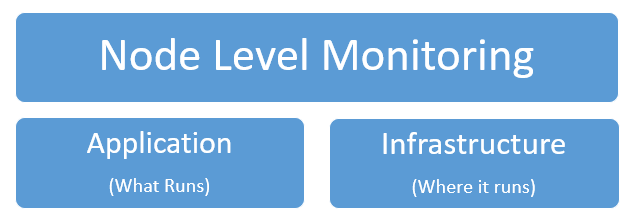
You can monitor the node-health at:
Application level
Infrastructure level
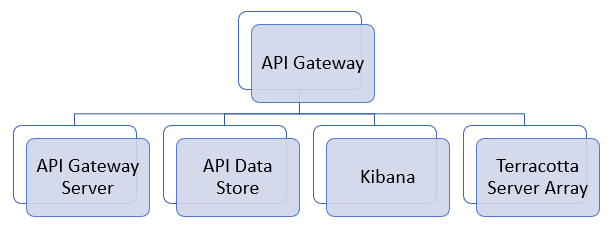
Application level
In application level, you can monitor the state, that is cluster status and console access of the application along with the resource utilization of the application of the following components of API Gateway:
API Gateway Server
API Data Store
Terracotta Server Array
Kibana
Note:
It is not required that all the components are co-hosted on the same node. Few components such as API Data Store,
Terracotta Server Array and so on can be hosted on dedicated nodes .
You can check both the cluster status and console access only for
API Gateway server and the cluster status for API Data Store and Terracotta Server Array.
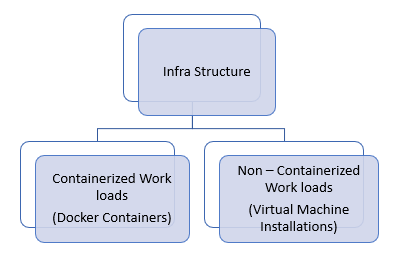
Infrastructure level
At the infrastructure level, you can monitor both containerized workloads (Docker containers) and non-containerized workloads (Virtual machine installations).
Note:
Most health checks are infrastructure-agnostic and can be used on both the types of infrastructure.
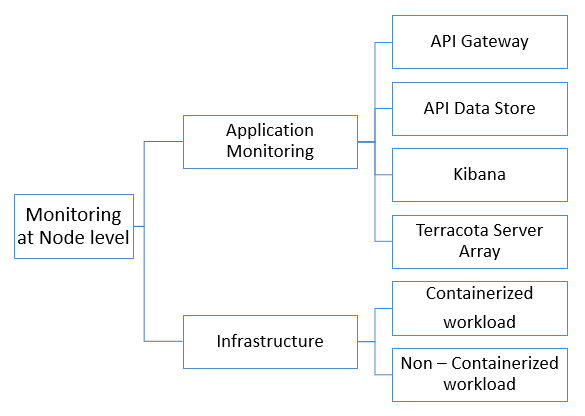
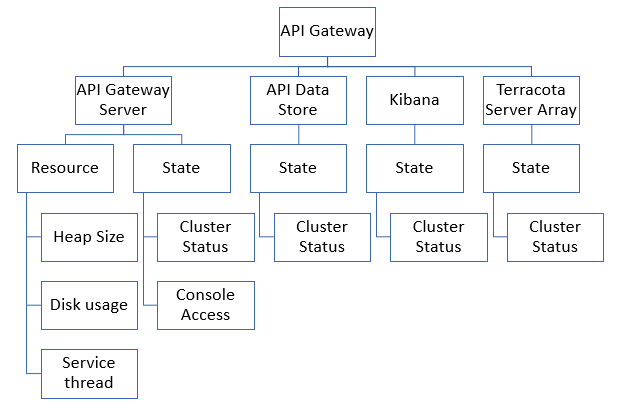
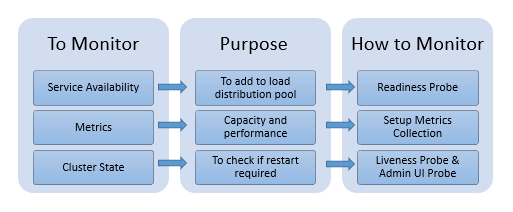
The overall node-level monitoring is explained in the following diagram.
The node-level monitoring in detail with the state and resource information of each component is explained in the following diagram.
How do I monitor the node health of API Gateway?
You can set up the Readiness probe, Liveness probe, and Admin UI probe to monitor the overall health status of a particular node of API Gateway.
How do the probes help in node-level monitoring?
| Readiness Probe | Liveness Probe | Admin UI Probe |
What is it? | Indicates if the traffic-serving port of a particular API Gateway node is ready to accept requests. | Reports on the overall cluster health and indicates if the components of a particular API Gateway node are in an operational state. | Indicates if the API Gateway administrator consoles are available and accessible on a particular API Gateway node. |
When is it used? | To check if a particular node of API Gateway can be added to the load balancer. | To check if a node requires a restart or if there is a problem that needs immediate attention. |
How does it help in containerized workloads? | If the health check fails, the pod is removed from the endpoints of the service. Hence, traffic is not served until it is ready. The pod is not removed or restarted. | If the health check fails, the pod is removed and restarted (self-healing mechanism). |
How does it help in non-containerized setup? | If the health check fails, the node can be removed from the endpoints of the load balancer. Hence, traffic is not served until it becomes ready. | If the health check fails, automated alerting can be setup. Manual intervention is required to resolve and restart. |
Note:
Readiness Probe continues to reply
200 OK if
API Gateway remains in an operational state to serve the requests.
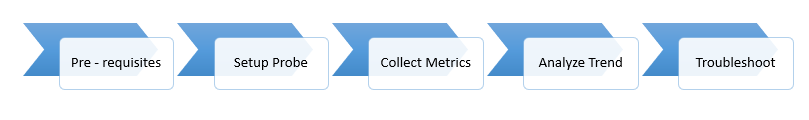
How do I set up probes and collect metrics to monitor the health of all components of API Gateway at node-level?
Note:
Startup probe is available in the recent versions of Kubernetes and is a recommended alternative to the liveness probe during the bootstrapping of the application. The endpoint is the same as that of the liveness probe but the Startup probe in Kubernetes itself is configured with slightly different characteristics like initial delay for the first check, failure threshold and so on.
Metrics:
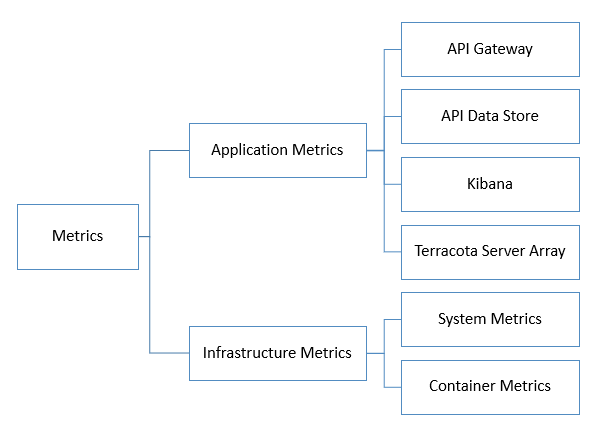
You can monitor the resources of API Gateway server, API Data Store, Terracotta, and Kibana with various metrics. A metric is a measurement related to health, capacity, or performance of a given resource such as CPU, Disk, and so on. Software AG offers you the capability to monitor both application metrics and infrastructure metrics. You can gain insight into the consumption and availability of resources, which in turn helps you identify and analyze the root cause and debug the issues quickly. This helps you to determine when to scale up the applications. This improves the overall business continuity and reduce the application downtime.
The following diagram explains the different types of metrics.
You can check the availability of each component in the node individually in the following sections under application monitoring.