Monitoring API Gateway
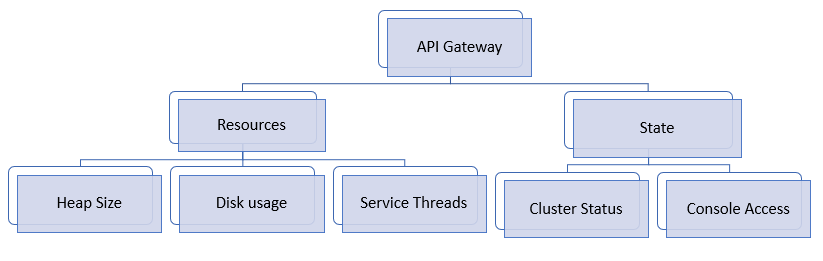
As part of application monitoring, you can monitor the state, that is the cluster status and console access of API Gateway along with the resources.
How do I set up probes to monitor the health of API Gateway?
Pre-requisites:

You must be a valid
API Gateway user for using the Liveness probe and Admin UI probe.
All the node level probes must be setup to target the local instance, typically, localhost.
Software AG recommends to set up a dedicated port for monitoring with an appropriate private thread pool.
Note:
Metrics collection is reported in the Prometheus data format. Prometheus is a non-
Software AG dashboarding tool that helps in trend analysis. For more information, see
https://prometheus.io/.
Set up Readiness Probe at Node-Level
To monitor the readiness of API Gateway, that is to check if the traffic-serving port of a particular API Gateway node is ready to accept requests , use the following REST endpoint:
The following table shows the response code and the status.
Response | Status |
200 OK | Readiness check is successful. Readiness probe continues to reply OK if API Gateway remains in an operational state to serve the requests. |
500 Internal server error | Readiness check failed and denotes a problem. |
timeout or no response as the request did not reach the probe | Several factors can contribute to the delay when the Readiness Probe initiates, which may result in the timeout errors. To know the reasons for timeout errors, see
Causes for timeout errors for more information. |
Note:
By design, response JSON is not returned when there is a problem.
Set up Liveness Probe at Node-Level
To monitor the liveness of API Gateway, that is to check the overall cluster health and to identify if the components of a particular API Gateway node are in an operational state, use the following REST endpoint:
GET /rest/apigateway/health/engine
The following table shows the response code and the status.
Response | Status |
200 OK | Liveness check is successful. |
500 Internal server error | Liveness check failed and denotes a problem. The response JSON indicates the problem. |
timeout or no response as the request did not reach the probe | Several factors can contribute to the delay when the Liveness Probe initiates, which may result in the timeout errors. To know the reasons for timeout errors, see
Causes for timeout errors for more information. |
The response JSON of each health check request displays a status field as the first entry in the response. The status can have the values green, yellow or red describing the overall status of the components to check.
The overall status can be green or red.
Green indicates that the cluster is in a healthy state.
Red indicates the cluster failure and an outage.
The overall status is assessed based on the API Data Store status as follows.
When the internal status of API Data Store signals
green or
yellow, the overall status is
green.
Yellow indicates node failure. However, the cluster is still functioning and operational.
When the internal status of API Data Store signals
red, the overall status is
red.
When API Data Store port is inaccessible, the overall status is
red.
The overall status is assessed based on the Integration Server status as follows.
When one of the resource types memory, diskspace, and servicethread reveals a resource problem, then the overall engine status is set to yellow.
The status of Terracotta is displayed.
Green indicates that
Terracotta server array is in a healthy state
Red indicates poor health and an outage.
A sample HTTP response is as follows:
{
"status": "green",
"elasticsearch": {
"cluster_name": "SAG_EventDataStore",
"status": "yellow",
"number_of_nodes": "1",
"number_of_data_nodes": "1",
"timed_out": "false",
"active_shards": "95",
"initializing_shards": "0",
"unassigned_shards": "92",
"task_max_waiting_in_queue_millis": "0",
"port_9240": "ok",
"response_time_ms": "526"
},
"is": {
"status": "green",
"diskspace": {
"status": "up",
"free": "908510568448",
"inuse": "104799719424",
"threshold": "101331028787",
"total": "1013310287872"
},
"memory": {
"status": "up",
"freemem": "425073672",
"maxmem": "954728448",
"threshold": "92222259",
"totalmem": "922222592"
},
"servicethread": {
"status": "up",
"avail": "72",
"inuse": "3",
"max": "75",
"threshold": "7"
},
"response_time_ms": "258"
},
"terracotta": {
"status": "green",
"nodes": "1",
"healthy_nodes": "1",
"response_time_ms": "22"
}
}
The overall cluster status is green since all components work as expected.
Set up Admin UI Probe at Node-Level
To check the availability and health status of the API Gateway administration service (UI, Dashboards) on a particular API Gateway node, use the following rest endpoint:
GET / rest/apigateway/health/admin.
The following table shows the response code and the status.
Response | Status |
200 OK | Everything is good |
500 Internal server error | Denotes a problem. The response JSON indicates the problem. |
timeout or no response as the request did not reach the probe | Several factors can contribute to the delay when you initiate the Admin UI Probe, which may result in the timeout errors. To know the reasons for timeout errors, see
Causes for timeout errors for more information. |
The overall admin status can be green or red based on the API Gateway administration service's health and Kibana status.
The overall admin status is assessed based on the Kibana status as follows:
When Kibana's port is accessible, the overall status is
green.
When Kibana's port is inaccessible, the overall status is
red.
When Kibana's communication with API Data Store is not established, the overall status is
red.
A sample HTTP response is as follows:
{
"status": "green",
"ui": {
"status": "green",
"response_time_ms": "40"
},
"kibana": {
"status": {
"overall": {
"state": "green",
"nickname": "Looking good",
"icon": "success",
"uiColor": "secondary"
}
},
"response_time_ms": "36"
}
}
The overall status is green since API Gateway administration service and Kibana is in a healthy state.
How do I collect metrics?
To check the usage of the application and system parameters, use the following metrics endpoint: GET /metrics. When the endpoint is called, API Gateway gathers metrics and returns the data in the Prometheus format. You can also use GET /rest/apigateway/health/engine to check the health of the resources of API Gateway like CPU, disk space and memory. When one of the resource types reveals a resource problem, then the overall engine status is set to yellow in the response.
Application Metrics
Monitor the following metrics to analyze API Gateway health.
Threads statistics
Service errors
Memory usage of JVM
HTTP or HTTPS requests
Log monitoring
Note:
The threshold values, configurations, and severities that are mentioned throughout this section are the guidelines that Software AG suggests for an optimal performance of API Gateway. You can modify these thresholds or define actions based on your operational requirements.
For details about how to generate thread dump, heap dump and log locations, see
Troubleshooting: Monitoring API Gateway.
If the metrics return an exceeded threshold value, consider the severity as mentioned below and perform the possible actions that Software AG recommends to identify and debug the problem and contact Software AG for further support.
Monitor the Threads statistics
To check the percentage of total number of threads used for service execution where the threads are obtained from the server thread pool, use the following metric:
sag_is_service_threads
If the threads usage is above the recommended threshold value for more than 15 minutes, you can consider the severity as mentioned and perform the possible actions listed to identify the reason.
Threads usage: Above 80% threshold, Severity: ERROR
Threads usage: Above 90% threshold, Severity: CRITICAL
The steps to identify the causes of higher threads usage are as follows:
1. Identify the process that consumes the highest number of threads.
2. Generate the thread dump.
3. Analyze the thread dump to identify the thread locks.
4. Analyze the logs of all the instances.
Monitor the Service errors
To check the number of services that results in errors or exceptions, use the following metric:
sag_is_number_service_errors
If service errors are encountered, you can consider the severity as ERROR.
The steps to identify the causes of service errors are as follows:
1. Check the cluster status of API Gateway using the following REST endpoint: GET /rest/apigateway/health/engine to know if API Gateway is healthy and is in a cluster mode.
2. Check the server logs for any exception from SAGInstallDirectory\IntegrationServer\instances\instance_name\logs\server.log.
Monitor the Memory usage of JVM
To check the percentage of total used memory of JVM, use the following metric:
sag_is_used_memory_bytes
If the memory usage is above the recommended threshold value for more than 15 minutes, you can consider the severity as mentioned and perform the possible actions listed to identify the reason.
Memory usage: Above 80% threshold, Severity: ERROR
Memory usage: Above 90% threshold, Severity: CRITICAL
The steps to identify the causes of higher memory usage of JVM are as follows:
1. Check the cluster status of API Gateway using the following REST endpoint: GET /rest/apigateway/health/engine to know if API Gateway is healthy and is in a cluster mode.
2. Generate the heap dump.
3. Analyze the logs of all the instances.
4. Identify the server that has an issue and restart the server if required.
5. Perform the following actions after restarting the server:
a. Check for the readiness of API Gateway.
b. Check the cluster status of API Gateway using the following REST endpoint: GET /rest/apigateway/health/engine to know if API Gateway is healthy and is in a cluster mode.
c. Check the resource availability of all the required system resources like memory, heap, and disk.
d. Check the Elasticsearch connectivity with API Gateway server.
e. Check the Terracotta client logs for errors in Terracotta communication for a cluster set up.
Monitor the HTTP or HTTPS requests
To check the percentage of total number of HTTP or HTTPS requests since the last statistics poll, use the following metric:
sag_is_http_requests
The statistics poll interval is controlled by the watt.server.stats.pollTime server configuration parameter and the default interval is 60 seconds.
If the total number of HTTP or HTTPS requests since the last statistics poll is above the threshold limit that is based on the Throughput Per Second ( TPS ) value, you can consider the severity as ERROR.
Log monitoring
It is essential to monitor the logs regularly. Perform the following actions to monitor the logs storage:
1. Check for the availability of all logs frequently.
2. Check if the log rotation works as configured for all file types.
3. Check the size of the log file to know if it is greater than the configured values.
To monitor the logs in different levels, check the availability of logs in FATAL, ERROR or WARNING level.
Infrastructure Metrics
Infrastructure metrics include system metrics and container metrics. For information about container metrics, see
Container Metrics.
System Metrics
It is important to monitor the following system metrics for an optimal performance of API Gateway.
CPU usage
Disk usage
Memory usage
Monitor the CPU usage
To check the percentage of CPU used by the Operating System, use the following metric:
sag_is_server_proc_sys_percent
To check the percentage of CPU used by the Integration Server JVM, use the following metric:
sag_is_server_proc_cpu_percent
If the CPU usage is above the recommended threshold value for more than 15 minutes, you can consider the severity as mentioned and perform the possible actions listed to identify the reason.
CPU usage: Above 80% threshold, Severity: ERROR
CPU usage: Above 90% threshold, Severity: CRITICAL
The steps to identify the causes of higher CPU usage is as follows:
1. Identify the process that consumes the highest CPU.
2. Generate the thread dump.
3. Analyze the thread dump to identify the thread locks.
4. Analyze the logs of all the instances.
5. If CPU spikes happen due to excess load, Software AG recommends you to monitor the load and scale up and scale down API Gateway if required. For more details about scaling, see
Monitor the Disk usage
To check the percentage of total available disk space in megabytes, use the following metric:
sag_is_server_total_disk_mbytes
To check the percentage of used disk space in megabytes, use the following metric:
sag_is_server_used_disk_mbytes
If the disk usage is above the recommended threshold value, you can consider the severity as mentioned and perform the possible actions listed to identify the reason.
Disk usage: Above 80% threshold, Severity: ERROR
Disk usage: Above 90% threshold, Severity: CRITICAL
The steps to identify the causes of higher disk usage are as follows:
1. The events archived in API Gateway are stored in the temp directory in the following location: SAGInstallDirectory\profiles\IS_instance_name\workspace\temp. Check the size of the temp directory and clean up the space to reduce the disk usage.
2. Check if the log rotation works as configured for the following file types: server, audit, error, session, wrapper, osgi, and API Gateway and check the size of the log files that consume more disk space to know if it is greater than the configured values.
3. Purge the events periodically to clean up the disk space for better performance of API Gateway.
Monitor the Memory usage
To check the percentage of total amount of physical memory available in megabytes, use the following metric:
sag_is_server_total_memory_mbytes
To check the percentage of total amount of physical memory used in megabytes, use the following metric:
sag_is_server_used_memory_mbytes
If the memory usage is above the recommended threshold value for more than 15 minutes, you can consider the severity as mentioned and perform the possible actions listed to identify the reason.
Memory usage: Above 80% threshold, Severity: ERROR
Memory usage: Above 90% threshold, Severity: CRITICAL
The steps to identify the causes of higher memory usage is as follows:
1. Identify the process that consumes more memory.
2. Check the cluster status of API Gateway using the following REST endpoint: GET /rest/apigateway/health/engine to know if API Gateway is healthy and responding.
3. Generate the heap dump.
4. Analyze the logs of all the instances and identify the file that consumes more memory.
5. Identify the server that has an issue and restart the server if required.
6. Perform the following actions after restarting the server:
a. Check for the readiness of API Gateway.
b. Check the cluster status of API Gateway using the following REST endpoint: GET /rest/apigateway/health/engine to know if API Gateway is healthy and is in a cluster mode.
c. Check the resource availability of all the required system resources like memory, heap, disk.
d. Check the Terracotta client logs for errors in Terracotta communication for a cluster set-up.
For more details about the API Gateway metrics, see Developing Microservices with webMethods Microservices Runtime.