Monitoring Terracotta
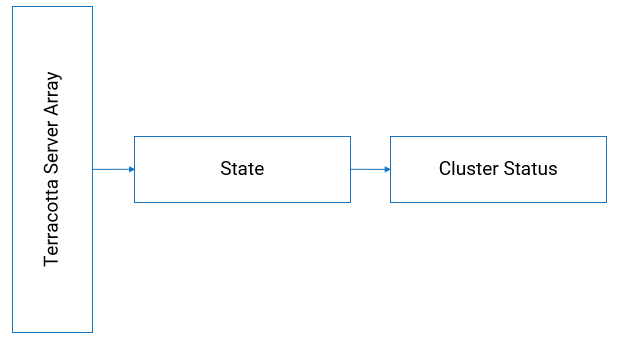
As part of application monitoring, you can monitor the state, that is the cluster health of Terracotta Server Array.
How do I monitor the health of Terracotta Server Array?
Liveness Probe at Node-Level
To monitor the liveness of Terracotta server, that is to check the cluster health status of Terracotta, run the following script:
SAGInstallDirectory/Terracotta/server/bin/server-stat.sh
Check the following condition from the response to verify the liveness of the server.
<server>.health = OK
AND
<server>.role = ACTIVE/PASSIVE
Following is one of the responses based on which Terracotta instance (active or passive), the health check is done:
server.health: OK
server.role: ACTIVE
server.initialState: START-STATE
server.state: ACTIVE-COORDINATOR
server.port: 9540
server.group name: TSA API Gateway
or
server.health: OK
server.role: PASSIVE
server.initialState: START-STATE
server.state: PASSIVE-STANDBY
server.port: 9540
server.group name: TSA API Gateway
The following table shows the response code and the description.
Response | Description |
200 OK | Runtime service health check is successful. |
500 Internal server error | Runtime service health check failed and denotes a problem. If the Runtime service health check fails, restart Terracotta server. |
timeout or no response as the request did not reach the probe | Several factors can contribute to the delay when the Runtime Service Health Probe initiates, which may result in the timeout errors. To know the reasons for timeout errors, see
Causes for timeout errors for more information. |
Readiness Probe - Node Level
To monitor the readiness of Terracotta server, that is to check if Terracotta server is ready to serve the requests, use the same script that is mentioned for the liveness check and monitor the readiness.