
Application Designer offers flexible, easy-to-use controls and server side Java APIs to support reporting. Reporting functions include:
Simple reporting document output, including
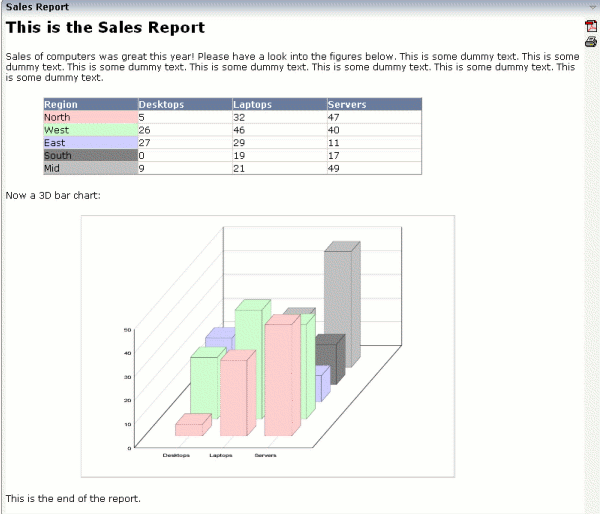
output of tables
output of text
output of statistical graphics
The reporting output is automatically rendered into HTML and/or PDF without developers to take care of.
In addition, Application Designer provides a Java API to create a rich set of statistical charts. Functions in this area include:
Various types of charts:
pie chart
bar chart
3D bar chart
point chart
line chart
aggregation chart
Different types of charts can be mixed - e.g. you can combine lines and bars inside one chart.
Charts can be rendered into
SVG format (scalable vector graphics) - a W3C standard that is supported by up-to-date browsers
JPG format
While in principle Application Designer delivers independent APIs for the various issues (e.g. the charting API is independent from the reporting output API), all can be combined in order to write nice looking reports:
Reporting is not an island on its own but can be integrated easily in any Application Designer page, i.e. the output is done inside a normal Application Designer control that you place into an Application Designer page.
The objective of Application Designer reporting is:
Create nice looking reports in an efficient way.
Offer a report rendering API that can be flexibly used by your application logic frameworks.
Have an automated PDF generation.
Provide interactivity so that reports can be linked to other parts of your application.
In short: we do not provide a full-fledged reporting tool for SQL type of reporting - we offer something small and smart that is easy to integrate and to adapt into your application.