
Eclipse contains an excellent debugging environment for debugging your Application Designer applications.
For debugging, you have to start Application Designer in remote debugging mode. This is done by executing the batch file <installdir>/bin/CIS_debug.bat. The port for debugging is defined in this batch file. If you want to use a port different from the standard port, you have to modify the batch file accordingly.
When you are using the Eclipse plug-in, it is required that the HTML mode is active. When you are debugging with the Layout Painter, you have to activate HTML in the preview configuration. When you are debugging with the Layout Tester, you have to activate the display mode HTML in the properties of the Eclipse project.
![]() To configure the debug environment in Eclipse
To configure the debug environment in Eclipse
Select the Eclipse project that you want to debug.
From the menu, choose .
In the tree of the resulting dialog box, select Remote Java Application.
Choose the "New" button to create a debug configuration for the selected project.
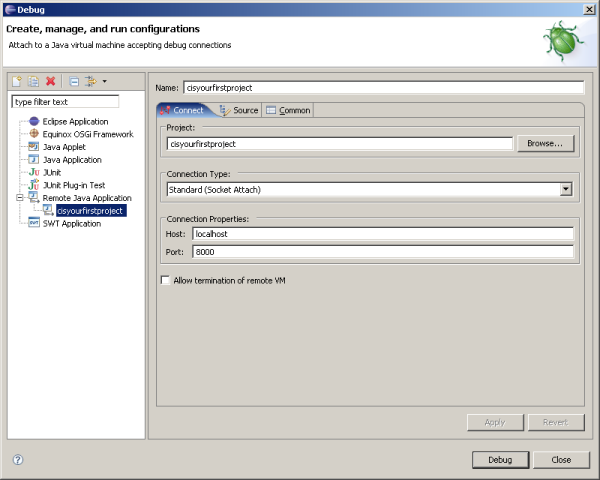
Make sure that the port which is specified in Connection Properties group box is the same as defined in the file CIS_debug.bat.
Choose the button.
After having configured the debug environment, execute the batch file CIS_debug.bat.
Or:
Choose the corresponding shortcut from the Windows
menu. See also
Starting the
Servlet Container in the Development
Workplace documentation.
Start debugging in Eclipse.
The debugger will connect to the virtual machine.