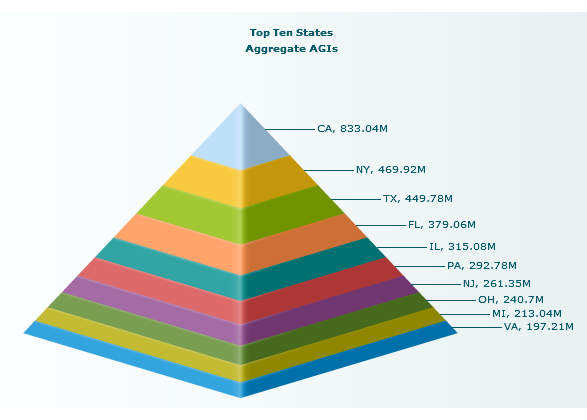
Pyramid Chart
Pyramid charts display a single series or data point for a set of records in a progression of slices of a three-dimensional pyramid. Both the decreasing circumference of the pyramid and the overall depth of each slice indicate the size of the data.
For more information on this view, see
Characteristics and
Configure This View. For an alternate presentation of progressive numerical data, see
Funnel Chart.
There are two possible relationships between a slice and the records in the data set:
 1-to-1
 where each record represents one slice.
Aggregated where an aggregate value of multiple records are shown as one slice.