Kagi Chart
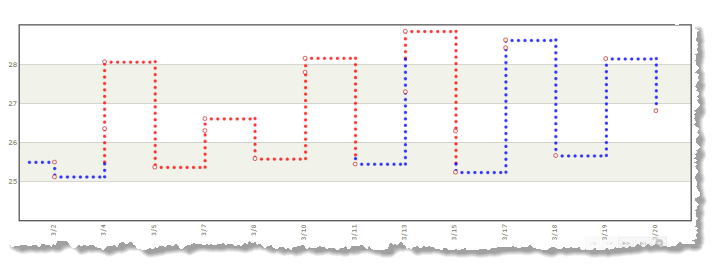
Kagi Charts display a stepped line indicating the change in trend (up or down) for one numeric dimension. Color indicates a change in trend that exceeded thresholds. The thresholds for this chart default to the last high value or low value, but can also be set as a percentage of the range or values or as absolute values.
A common example for a Kagi chart is a line for price that reflects changes in supply and demand. Or changes in stock, commodity or currency prices.