Bullet Gauge
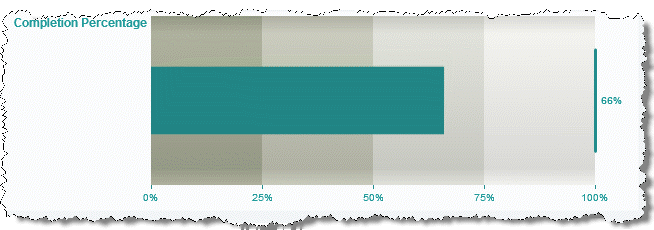
Bullet gauges display a single numeric data point as a bar in relation to a scale and a target on that scale. Bullet graphs are similar to bar or column charts and can be either horizontal or vertical.
Note: | Because a gauge shows a relation of one data point, gauge views create multiple pages, one for each datapoint, when mashable or mashup results contain repeating items. This is very similar to the Record Detail view where each row in the results is displayed as one page. |
As with all Business Analytics built-in gauge views, you can configure several gauges per view with a mix of gauge types.

