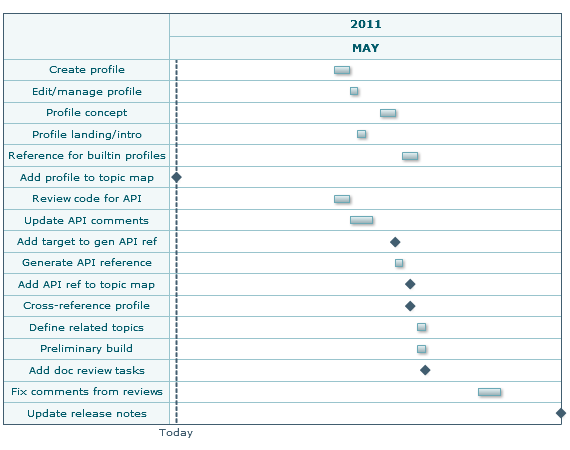
Visual Effects of Optional Data Configuration for Gantt Charts
The most minimal Gantt chart provides task descriptions and start/end dates, as shown in this example:
Minimal Gantt Chart with Task, Start and End Date Only
The next example shows the effect of adding pecentage of completion and dependency data to the chart:
Minimal Gantt Chart Plus % of Completion and Dependencies
The Processes field allows you to group tasks, but also affects labelling and tooltips for tasks. The Tasks Tooltip field affects tooltips and behaves differently when combined with Processes. The effects of these two fields are:
 Using Just Processes
Tasks are grouped under each Process, so the left column displays the Process value rather than the task description.

Each task bar in the timeline has a label showing both the task description and the start/end date range.

The tooltip for each task matches the task bar label.
 Using Just Tooltip
Tasks are on individual lines, so the left column displays the Process value rather than the task description.

Each task bar in the timeline has a label showing just the tooltip value.

The tooltip for each task shows both the tooltip value and the start/end date for the task.
 Using Both Processes and Tooltips
Tasks are grouped under each Process, so the left column displays the Process value rather than the task description.

Each task bar in the timeline has a label showing the task description.

The tooltip for each task shows just the tooltip value.


