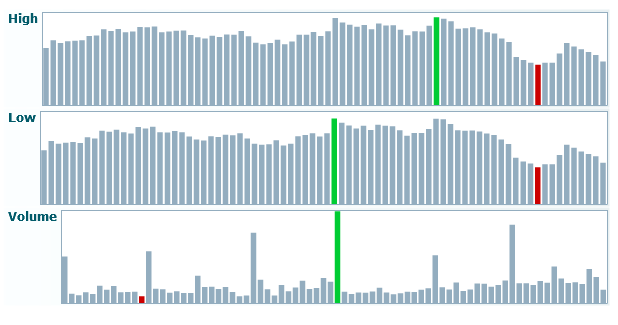
Sparkline Column
Sparkline column charts are useful in displaying trends for one or more series (a column in the dataset) in a summary, highly compressed form with minimal highlights. Each series displays a set of columns progressing in the order that records appear in the dataset. Highlights are shown for the high and low values.
Tip: | The number of records determines how many bars appear on each line. For large numbers of records (> 50), you can use pagination with this chart to provide better visibility for bars. |
For more information on using the Sparkline Column view, see
Characteristics and
Configure This View.
For alternate formats, see
Sparkline and
Sparkline win_loss. You can also include sparkline column
mini-charts for a column in a
Grid and KPIs View. For a reverse relationship between records and data points, see the
Column Chart or
Bar Chart.