Pie graph: Wedge group
Properties in this group control the appearance of the pie's wedges, including thickness, gradient effect, and color.
Wedge group properties
This group contains the following properties:
pieThickness
Sets the thickness of the wedges in pixels.
This property is in the Wedge property group.
wedgeGradientFlag
Select the box to enable the gradient effect in the wedges.
This property is in the Wedge property group.
wedgeProperties
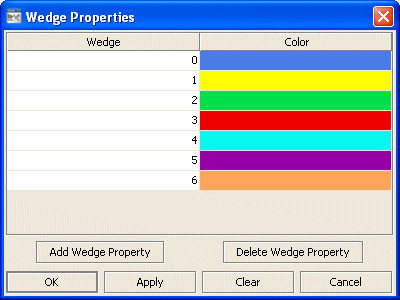
Use this property to assign a color to each wedge in a pie graph. In the Object Properties window, double-click on wedgeProperties in the Property Name field to bring up the Wedge Properties dialog.
Note:
Before you assign attributes to wedges in your pie graph, it is recommended that you first attach the pie graph to data.
The Wedge Properties dialog has two columns of fields:
 Wedge
Wedge: Each wedge from the pie graph is listed.
 Color
Color: Select the ellipsis button in the and choose a color from the palette. Close the
Color Chooser window.
The dialog has the following buttons:
 Add Wedge Property
: Click to add a wedge entry field. The data for the wedge does not have to be available yet. You may consider adding and assigning attributes to more wedges than your data currently needs for when you have more data to show.
 Delete Wedge Property
: Removes the last wedge entry field from the Wedge Properties dialog.
 OK
OK: Applies values and closes the dialog.
 Apply
Apply: Applies values without closing the dialog.
 Reset
Reset: Resets all fields to last values applied.
 Clear
Clear: Clears all fields. Detaches object from data source (once Apply or OK is selected).
 Cancel
: Closes the dialog with last values applied.
This property is in the Wedge property group.
