Using the EPL memory profiler
The information in this topic applies to the correlator only.
You use the EPL memory profiler to display information on monitors and monitor instances.
The EPL memory profiler is invoked using the -r (or --dorequest) option of the engine_management tool, followed by a request. Several requests are available for the EPL memory profiler, which are described below.
Important:
Do not use these requests on latency-sensitive applications. You should use them routinely only when developing or debugging.
When a request is issued, the correlator execution is momentarily paused to gather statistics.
The information that is returned for a request can be viewed directly (for example, in the Apama Command Prompt), or it can be written to a comma-separated values (CSV) file which can easily be viewed in tabular form using a tool such as Microsoft Excel.
Note:
All byte counts returned by a request are approximate values. The EPL memory profiler only shows memory usage that can be directly attributed to individual monitor instances. There are some parts of the correlator runtime that are not tracked, but these are typically small and fixed. Any memory used by Java or C++ plug-ins is not tracked. The profiler is useful in indicating the shape of the memory usage of an application - which monitors and event types are using more memory in proportion to the rest of the EPL runtime.
The values returned for the number of bytes and the number of EPL objects also include EPL objects that are no longer being used, and have not yet been garbage-collected. Therefore, the values will never be precise unless you are lucky enough to make this request just after garbage collection has run. See also
Garbage collection.
The size of event expressions, including internal data structures associated with them, is excluded (and is typically small).
Each request returns the following string, in addition to the column headers described below:
"Version:version, Snapshot time:time, Component ID:id, Host:host-name, Port:port, EPL memory:bytes"
String element | Output |
Version:version | Information on the correlator version. |
Snapshot time:time | Time at which the EPL memory profiler has taken the snapshot. This is the date in milliseconds. The date 1446716459541, for example, translates into Thu Nov 05 2015 09:40:59 in UTC time. |
Component ID:id | Correlator component ID. |
Host:host-name | Name of the host on which the correlator is running. |
Port:port | Port number on the above host. |
EPL memory:bytes | Total memory used by the EPL types in the correlator. |
Returning information on all monitors
The following command returns information on all the monitors in the correlator:
engine_management -r eplMemoryProfileOverview
This request does not take arguments. If arguments are passed, they are ignored.
The output shows the following information in the following order:
Column header | Information shown in this column |
Monitor | The name of the monitor. |
Monitor instances | The number of monitor instances. |
EPL objects | The number of EPL objects created by the monitor instances (for example, dictionaries, events, sequences, and so on). |
Listeners | The number of active listeners. |
Bytes | The approximate number of bytes used by EPL objects created by the monitor instances. |
Overhead bytes | The approximate number of bytes covering miscellaneous internals that the correlator maintains for book-keeping per monitor instance. |
Returning monitor instance details
The following command returns information for all EPL types across the monitor instances of a specific monitor in the correlator:
engine_management -r eplMemoryProfileMonitorInstanceDetail monitor-name
where monitor-name is the name of the monitor.
You can also specify all to list the instance details of all monitors. The results are returned using the following sort order:
1. monitor name (ascending)
2. monitor instance ID (ascending)
3. EPL type (ascending)
The output shows the following information in the following order:
Column header | Information shown in this column |
Monitor | The name of the monitor. |
Persistent | true if the monitor is persistent. false it is not persistent. |
EPL type | The type of the EPL object (see
Types) and also any active listeners. The output shows one entry for each listener. For example, if there is a monitor with one instance, and which has 2 listeners where each listener has 10 active instances, then the output will contain 2 rows. The number of EPL objects will then be 10 for each row. |
Context name | The name of the context. |
Context ID | The ID of the context. |
Monitor instance ID | The ID of the monitor instance. |
EPL objects | The number of EPL objects created by the monitor instances (for example, dictionaries, events, sequences, and so on). |
Bytes | The approximate number of bytes used by EPL objects created by the monitor instances. |
The output for the context is a combination of EPL type and monitor instance. For example, if there are 10 monitor instances where each instance has lots of objects of 3 different types, then the output will have 30 rows.
Unlike other EPL objects which belong to a single monitor instance, some strings are shared between several monitor instances. When a string is only used by a single monitor instance, it is shown like any other object in the output of the request, that is, with an EPL type of string. However, if the same string is shared between multiple monitor instances, then each monitor or monitor instance that is using it will show the EPL type as string (shared). This is a performance optimization which avoids unnecessary copying. For example, a string may be shared in the following cases:

When a monitor containing a string spawns to another monitor instance.

When a monitor has a string that it sends inside an event to a monitor in another context.

When an input event containing strings is received by multiple monitor instances which then store these strings.
One of the implications of sharing is double-counting, for both the number of EPL objects and the number of bytes. If multiple monitor instances refer to the same shared strings, the output of the request will include these numbers against each monitor instance separately. However, the duplication is eliminated when object sizes are summed up for the EPL memory value, so it may end up being notably lower than the sum of the Bytes in each row.
Returning aggregated monitor instance details
The following command is similar to eplMemoryProfileMonitorInstanceDetail, except that it aggregates the object count and size from each monitor instance, displaying data per monitor rather than per monitor instance.
engine_management -r eplMemoryProfileMonitorDetail monitor-name
where monitor-name is the name of the monitor. You can also specify all to list all monitors, sorted by the monitor name.
The output shows the following information in the following order:
Column header | Information shown in this column |
Monitor | The name of the monitor. |
Persistent | true if the monitor is persistent. false it is not persistent. |
EPL type | The type of the EPL object (see
Types) and also any active listeners. The output shows one entry for each listener. For example, if there is a monitor with one instance, and which has 2 listeners where each listener has 10 active instances, then the output will contain 2 rows. The number of EPL objects will then be 10 for each row. |
EPL objects | The number of EPL objects created by the monitor instances (for example, dictionaries, events, sequences, and so on). |
Bytes | The approximate number of bytes used by EPL objects created by the monitor instances. |
This request also takes account of shared strings. See the description of the eplMemoryProfileMonitorInstanceDetail request for details.
Handling of reference types
For reference types (such as sequence and dictionaries), the size is not reflected in the object referencing it. Instead, the size is associated with the actual object which is referenced. For example, if an event references/contains a sequence, the size of the sequence has no effect on the byte count of that event.
The any type does not show up in the EPL memory profiler output. Reference types held in an any value show up as if they were held in a value of their type. Boxed primitives show up as a separate type (with the first letter in capitals) in the EPL memory profiler output; for example:
monitorName,false,..Integer,main,1,1,2,240
monitorName,false,AnyContainer,main,1,1,2,240
In the above example, there are two AnyContainer objects, and there are two boxed primitives (the ..Integer type). For both, there are two objects in memory and are consuming 240 bytes for each type.
Visualizing the EPL memory profiler information in Microsoft Excel
You can write the output from each of the above requests to a comma-separated values (CSV) file which can easily be viewed in tabular form using a tool such as Microsoft Excel.
The example below shows how to visualize the output of the eplMemoryProfileMonitorInstanceDetail request in Microsoft Excel using a pivot table.
1. Save the output of the request in a CSV file and open this file with Microsoft Excel.
2. Create a new PivotTable in Microsoft Excel, and in the resulting dialog select the range of data for the pivot table (ideally, the information for the entire range is already provided in the corresponding text box).
3. For this example, add the following fields to the report:
Monitor
EPL type
Context name
EPL objects
Bytes
If required, you can also add the following fields:
Monitor instance ID
Context ID
The monitor instance ID is helpful if multiple monitor instances exist within the same context.
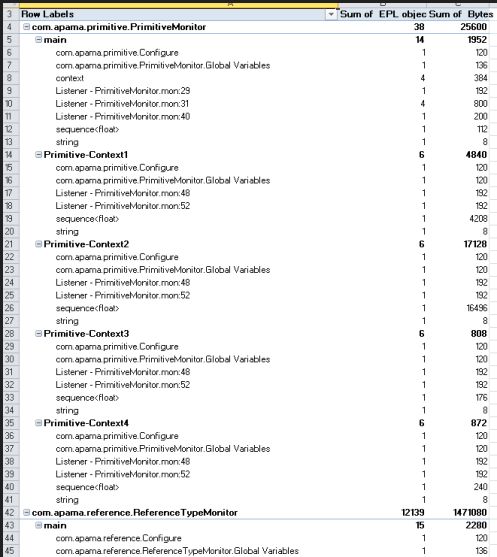
After you have added the fields, you can see the following in the table:

row labels which include the monitor name, the context name and the EPL type, and

columns which sum up the number of EPL objects and the approximate number of bytes.
For example:
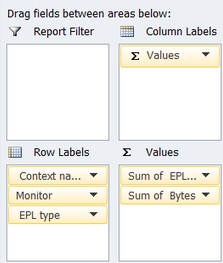
4. If you want to get an overview of the context level in the row labels, just drag the Context name label above the Monitor label as shown in the example below, and then check the changes in the report:
5. Similarly, if you want to see how the EPL objects are distributed over the different contexts and monitors, just move the EPL type to the very top of the row labels, followed by the Monitor and Context name labels.
6. Once the data is shown as wanted in the table, you can conditionally format the table to highlight individual columns, for example, to show high values or values that are above the threshold or above the average. Detailed information on how to do this can be found in the Excel help.
A basic use case is to highlight the values for the object count and byte count that are above the average. To do so, select the Sum of EPL objects column and then choose the following command: Conditional Formatting > Top/Bottom Rules > Above Average. You can then select a formatting option from a dialog, for example, red text. As a result, all values in the cells of the Sum of EPL objects column that are above the average are shown in red. If you want, you can do the same for the Sum of Bytes column.
You can also use additional conditional formatting (for example, color scales) to highlight the cells with values above the average.

