Prometheus Integration
Terracotta logs metrics data in a form that can be understood by the open source data collection and filtering tool Prometheus, which is well-suited to cloud-based microservices environments. To log the data, Terracotta includes a servlet that gathers Prometheus-style metrics for put / get / save / delete operations. The Prometheus data can in turn be visualized by third party products that offer Prometheus integration (see the Prometheus web site at
https://prometheus.io/ for related information).
After you created a connection to a cluster, you can access a Prometheus compatible servlet at the following URL :
http(s)://[host]:[port]/actuator/prometheus
For example, assuming that the Terracotta Management Server (TMS) is available at http://localhost:9480, the servlet can be accessed at http://localhost:9480/actuator/prometheus.
Available metrics
For now, only resource usage metrics are available as Prometheus gauges (the same metrics as you would find under
Resource Usage Panel).
All metrics are prefixed with : sag_tc_server and share the same labels or tags (as part of the plain text output, with one metric per line) :

alias (can represent a server side cache resource name or an offheap resource name or a dataroot name or a dataset name)
connectionName
entityName (a technical attribute that represents the server-side entity name)
entityType (a technical attribute that represents the server-side entity type)
server (represents the server name)
stripe
clusterTierManager (caching resource only, matches the alias of the entity given by the user when connecting to a clustered cache, example:
terracotta://myhost:9410/anEntity)
Here is the list of provided metrics :
Server specific resource usage metrics
sag_tc_server_offheap_allocated_memory_bytes (Offheap memory allocated in bytes)
sag_tc_server_restartable_store_total_usage_bytes (FRS usage in bytes)
sag_tc_server_dataroot_total_disk_usage_bytes (Dataroot total disk usage in bytes)
Server-side caching specific resource usage metrics
sag_tc_server_caching_pool_allocated_size_bytes (Caching pool allocated size in bytes)
sag_tc_server_caching_store_data_size_bytes (Caching store data size in bytes)
Server-side store specific resource usage metrics
sag_tc_server_dataset_main_record_occupied_storage_bytes (Total occupied storage by the dataset, in bytes - this is the sum of the 3 dataset_occupied metrics below)
sag_tc_server_dataset_occupied_primary_key_bytes
sag_tc_server_dataset_occupied_persistent_support_bytes
sag_tc_server_dataset_occupied_heap_bytes
sag_tc_server_dataset_allocated_memory_bytes (Total allocated storage by the dataset, in bytes - this is the sum of the 4 dataset_allocated metrics below)
sag_tc_server_dataset_allocated_primary_key_bytes
sag_tc_server_dataset_allocated_persistent_support_bytes
sag_tc_server_dataset_allocated_heap_bytes
sag_tc_server_dataset_allocated_index_bytes
sag_tc_server_dataset_record_count (Dataset record count)
sag_tc_server_dataset_index_record_count (Dataset indexed record count)
sag_tc_server_dataset_index_access_count (Index access count)
sag_tc_server_dataset_index_occupied_storage_bytes (Index occupied storage in bytes)
Examples
This section shows examples of metrics data written to the log file.
1. Dataroot example
sag_tc_server_dataroot_total_disk_usage_bytes{alias="PLATFORM",
connectionName="MyCluster",entityName="VoltronTmsConnection:MyCluster",
entityType="org.terracotta.management.entity.nms.client.NmsEntity",
server="terracotta-1-0",stripe="stripe[0]",} 6.5570422E7
Dataroot (named "PLATFORM") total disk usage in bytes; captured from the server named "terracotta-1-0", part of the stripe named "stripe[0]" (first stripe), for the connection named "MyCluster" : 60MB
2. Caching example
sag_tc_server_caching_pool_allocated_size_bytes{alias="dedicatedcache",
clusterTierManager="MyCacheManager",connectionName="MyCluster",
entityName="MyCacheManager$dedicatedcache",
entityType=
"org.ehcache.clustered.client.internal.store.InternalClusterTierClientEntity",
server="terracotta-1-0",stripe="stripe[0]",} 9404416.0
Server side cache store (created by the cache "dedicatedcache", under the clusterTierManager named "MyCacheManager") allocated size in bytes; captured from the server named "terracotta-1-0", part of the stripe named "stripe[0]" (first stripe), for the connection named "MyCluster" : 9.4MB
3. Dataset index example
sag_tc_server_dataset_index_access_count{
alias="booleanCell$$$Boolean$$$BTREE",connectionName="MyCluster",
entityName="MyDataset-1",
entityType="com.terracottatech.store.client.DatasetEntity",server="terracotta-1-0",
stripe="stripe[0]",} 1604.0
Dataset (named "MyDataset-1") index (on the cell named "booleanCell" of type Boolean; using the BTREE setting) access count captured from the server named "terracotta-1-0", part of the stripe named "stripe[0]" (first stripe), for the connection named "MyCluster" : 1604 times
Getting the metrics directly from the servlet
Using any HTTP client, such as curl :
curl http(s)://[host]:[port]/actuator/prometheus
You can craft a regular expression to search for specific metrics :
curl -s http(s)://[host]:[port]/actuator/prometheus |
grep "sag_tc_server.*{.*} .*"
Security concerns
This servlet is accessible to anybody if your TMC is not secured, but only to authenticated users if you set up authentication and authorization.
Prometheus and Grafana integration
There are several ways to let Prometheus grab the metrics available at http(s)://[host]:[port]/actuator/prometheus.
For example, if you deployed the TMC using Kubernetes, and you created a service for it, you can simply add this YAML configuration to your service manifest to have Prometheus reading the metrics regularly :
metadata:
name: tmc
annotations:
prometheus.io/scrape: 'true'
prometheus.io/path: '/actuator/prometheus'
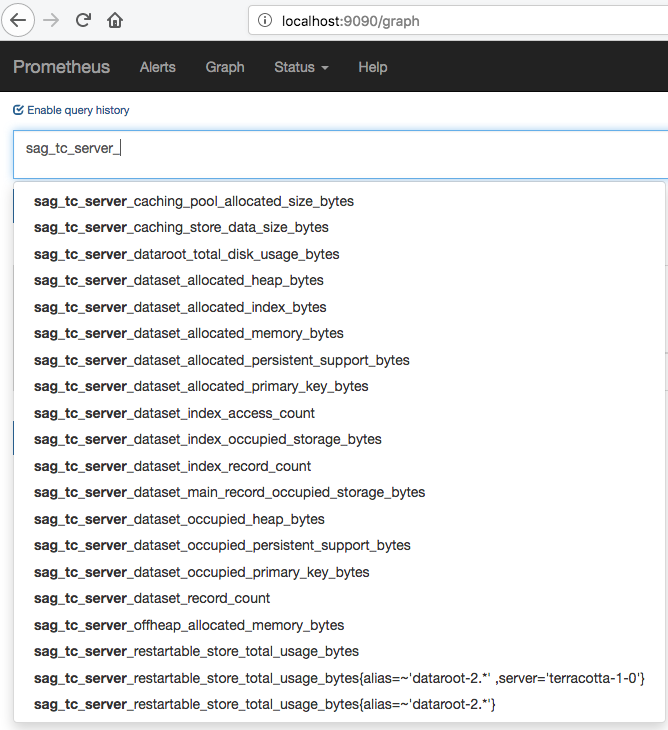
Prometheus querying
When you have successfully installed and deployed Prometheus, you'll be able to choose the Terracotta cluster metrics.
You can also precisely choose which metrics you want to display using the labels and the Prometheus query language (see
https://prometheus.io/docs/prometheus/latest/querying/basics/ for related information). For example, if you only want the FRS usage for the "dataroot-2" dataroot on the server "terracotta-1-0", you can use the following Prometheus query :
sag_tc_server_restartable_store_total_usage_bytes{
alias=~'dataroot-2.*',server='terracotta-1-0'}
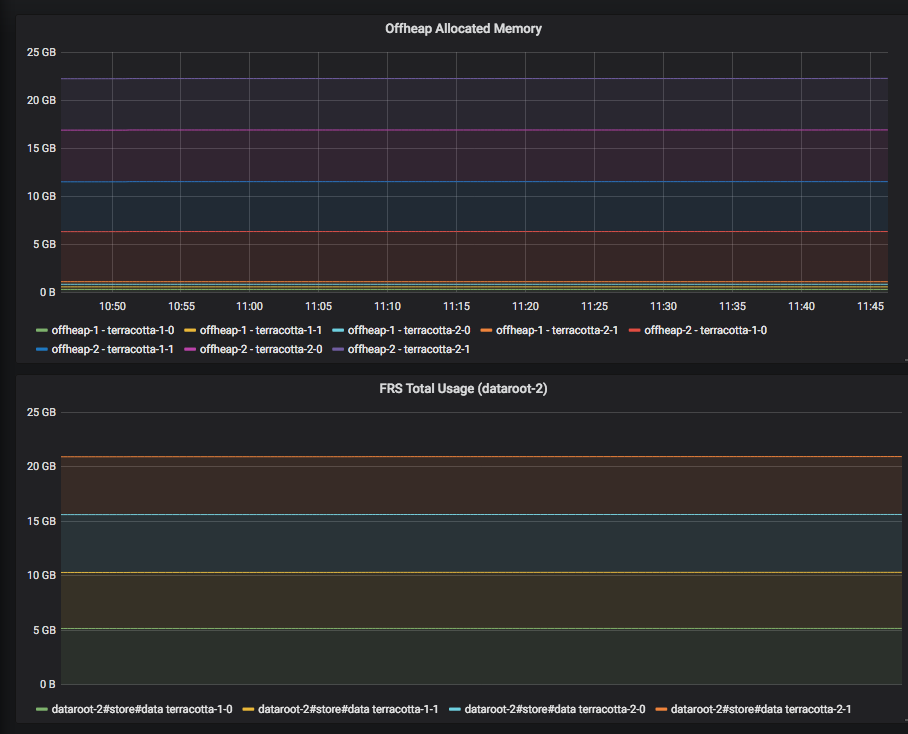
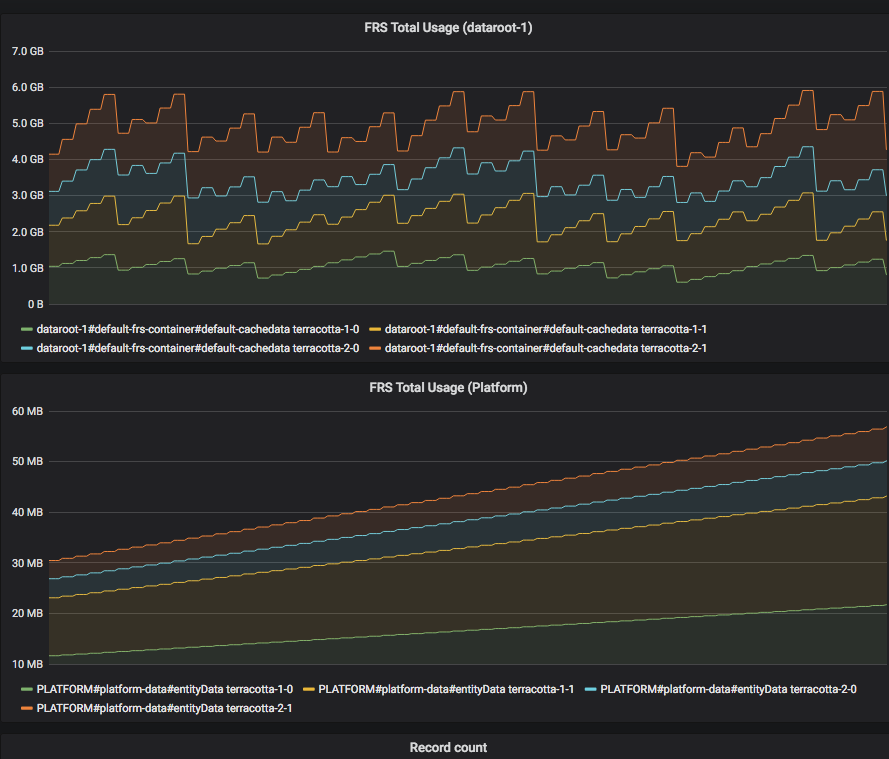
Grafana dashboards and panels
From Grafana, after you add a new Prometheus datasource, you can add some custom panels, using the metrics names as well as using Prometheus querying (see previous chapter).
To make things easier, we provided a Dashboard template on the Grafana website at
https://grafana.com/dashboards/10215; just import it and start monitoring resource usage from Grafana !