Using the Terracotta Management Console
The TMC Home Page
The TMC Home Page is where you:

create/delete persistent connections to your cluster(s)
optionally modify your connection properties
view
the status of the servers that make up your cluster
the various categories of clients making use of your cluster
the server entities that are contained by the cluster and to which clients connect
drill-down/jump to various presentations such as statistics and monitoring relating to those servers, clients, and entities
take actions, such a clearing the contents of a cache
Connections and Global Settings
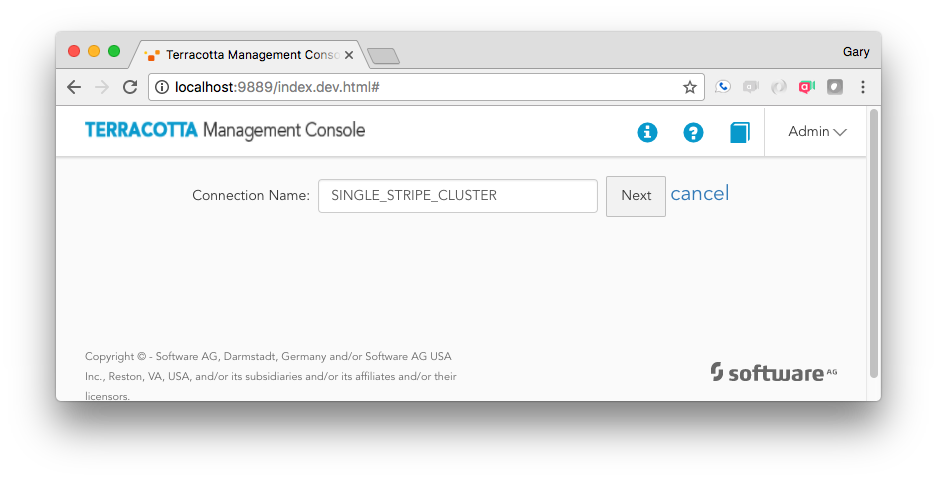
To create a persistent connection to a particular cluster:
1. click Create New Connection
2. in the Connection URL input area enter a URL addressing at least a single, running member of the fully configured TSA:
Terracotta Server URL
terracotta://<server-host>:<listen-port>
If the TMS is able to connect to the specified server, it will request the complete TSA topology, persisting the addresses of each server in its database. This means that, in the future, the TMS will be able to connect to the TSA, even if the originally specified server should be unreachable, as long as at least one member of the TSA is running.
3. enter the name you would like associated with this connection
This connection name will be used to disambiguate multiple connections in the UI and when communicating with the TMS REST interface.
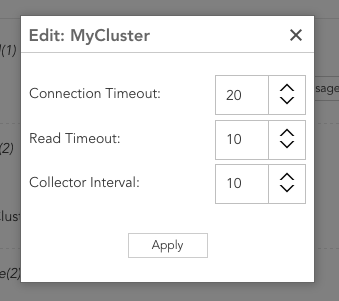
To modify your new connection’s properties, use the
Edit this cluster (

) icon on the connection’s header area.
Connection Timeout | Timeout value, in seconds, when connecting to a cluster the first time or when reconnecting. Default is 10 seconds. |
Read Timeout | Timeout value, in seconds, for all cluster communications. Default is 10 seconds. |
Collector Interval | Collector interval for statistics. Default is 10 seconds. |
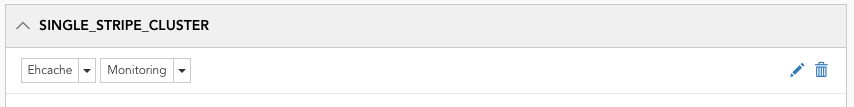
To delete an existing connection use the Delete this cluster (

) icon on the connection header area.
Using the Home Page
This section is an overview of the following sections. It should explain how the connection area presents the totality of the cluster, allows the user to drill-down to different levels of hierarchy to then jump to detail views, such as statistics or entity server-side resource usage.
Caching Entities
The new Terracotta Platform consists of client- and server-side entities that work together to provide highly-available, performant, distributed data access. In your application you configure a CacheManager, both on the client- and server-side. The client-side configuration relates to such things as the maximum OnHeap size-in-bytes for a particular cache. The server-side configuration relates to the remote storage tier that is used by your caches.
Each of your Caching Clients communicates with its remote storage tier when executing normal cache operations, such as putting an entry into the cache.
Caching clients configured to use the same remote storage tier are effectively sharing access to the same cache data.
Other Entities
Server entities created by 3rd parties, and therefore unknown to the TMC, appear here.
Currently there is not much that can be done with these entities, but a future release may allow for the declarative exposure of management and monitoring features from entities.
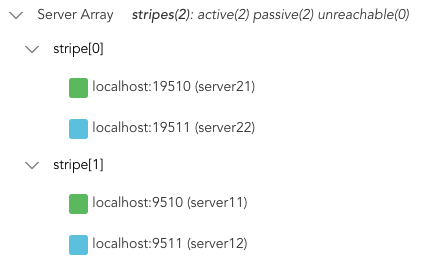
Server Array
The Terracotta Server Array is a collection of groups of servers, known as stripes. Servers within a stripe work together to provide High-Availability. When the Active server should fail, any one of the remaining Passive servers takes over as active. The Active serves to (1) handle requests from clients to entities it contains and (2) to relay those client requests to each of the Passives. Servers in different stripes do not interact.
The TMC presents the current state of the server array, indicating the roles of each server. The following shows a server array consisting of two stripes, each containing two members, one active and one passive.
Connected Clients
In the Terracotta Platform a client is an application end-point. In your application, the clustered CacheManager that is configured and initialized is a Terracotta Client. Each client maintains a connection to the active server in each stripe. In general, anything that connects to a server is considered a client.
For more information, see section
Terracotta Server > Terracotta Server Administration Guide > Clients in a Cluster.
Each client has a Client Identifer that serves to uniquely identify that client. The form of the identifier is:
<pid>@<ip-addr>:<client-type>:<server-entity-name>:<uuid>
where:
<pid> | the process identifier of the Java Virtual Machine hosting this client |
<ip-addr> | the ip address of the machine hosting this JVM |
<client-type> | [Ehcache | Unknown] |
<server-entity-name> | the name of the server-side entity the client is connected to |
<uuid> | a unique identifier that serves to disambiguate clients in the same JVM, accessing the same server entity |
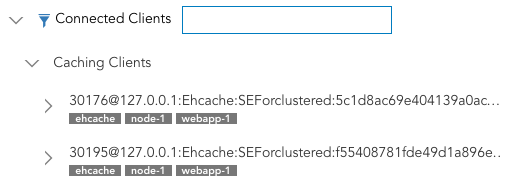
Caching Clients The following shows two caching clients.
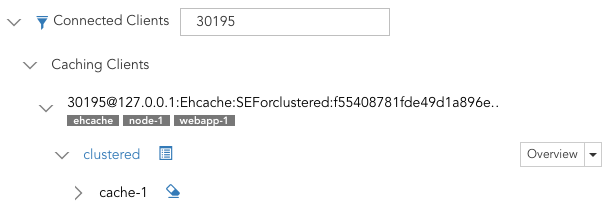
The input field located next to Connected Clients serves to show only those clients whose identifier contains the entered value. In the example above, entering 30195 (the process identifier of the 2nd client) would filter out the first client.
Filtering Rules
accepts a space-separated list of terms to match (prefix with ! to negate)
terms can apply to any components of the
Client Identifier or any supplied tags
negated terms must not match any of the above
clear the input field content or click the toggle button (

) to show all clients
Under each identifier is an optional set of user-defined tags, specified in the CacheManager's configuration.
Expanding a caching client exposes the CacheManager’s alias, which is defined in the configuration. The dropdown lets you jump to various detail views, pre-selecting this client and CacheManager in those views. View the CacheManager’s configuration by selecting the configuration (

) icon. The cache entries can be cleared by selecting the clear cache (

) icon.
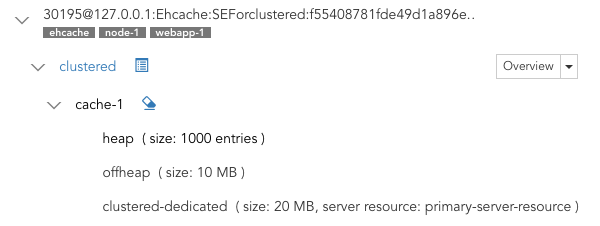
Expanding the cache shows important configuration elements related to that cache.
Other Clients In this version of the Terracotta Management Console, anything that is not a caching client is unknown to TMS.
About the Ehcache Tab
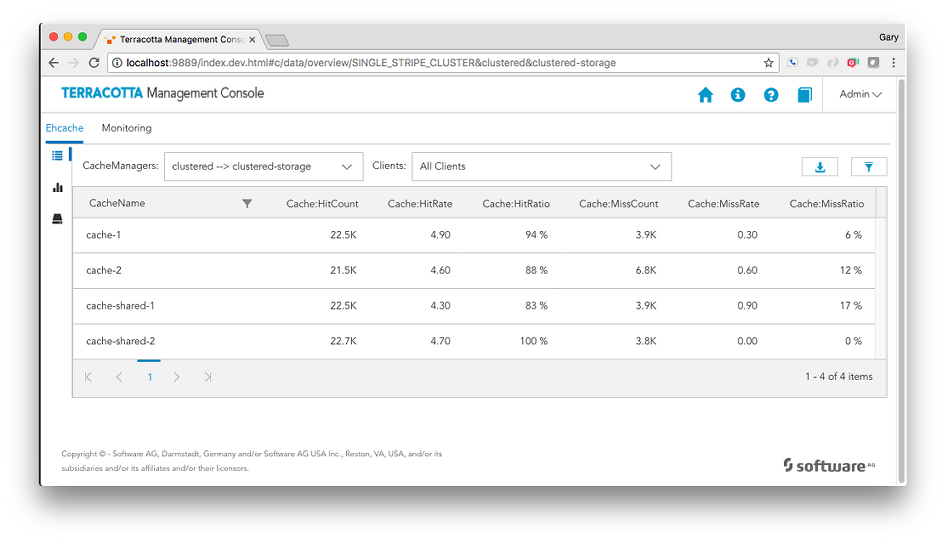
The Ehcache tab contains detailed presentations relating to your caching clients. You can view:
Overview statistics concerning this moment in time, in grid form
Historical statistics, in chart form
Cache size information
Your caching client automatically gathers and periodically sends to the TMS low-level statistics concerning counters and sizing. From those low-level statistics the TMS can synthesize a variety of derived statistics, such as rates (HitRate) and ratios (HitRatio).
The following categories of statistics are available:
Cache | encompasses all the following caching tiers |
OnHeap | the JVM heap tier |
OffHeap | the JVM OffHeap (direct memory) tier |
Disk | the disk tier |
Clustered | the cluster tier |
Overview Panel
The Overview Panel lets you view statistics concerning what is happening right now (or just a while ago) with your caching client, broken out by cache. By default the statistics are aggregated across all clients using the same CacheManager. Any particular caching client can also be selected for viewing.
Use the CacheManagers dropdown to select the aliased CacheManager for which to show statistics. The entries in this dropdown are of the form CacheManager Alias > Storage Handle due to the fact that different client-side CacheManagers can be configured to use the same storage on the TSA. Furthermore, CacheManagers that are otherwise identical can be configured with different aliases. We show the mapping here so you have a chance to disambiguate CacheManagers should you choose to configure them in this way.
Use the Clients dropdown to select a particular caching client for viewing. By default, statistics are aggregated across all clients of the selected CacheManager.
Additional Grid Features
Temporarily re-arrange grid columns via drag-and-drop
Sort on columns or filter on CacheName
Scrolls horizontally if the grid columns overflow the available space
Use the
Export (

) icon to download a spreadsheet of the currently displayed values.
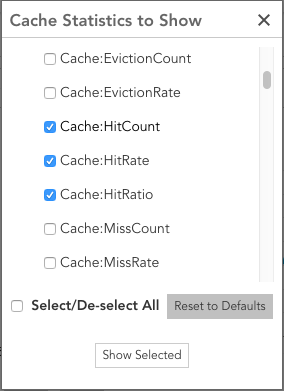
Use the
Filter cache statistics (
) icon to select which statistics to display. The set of statistics to view defaults to
Cache-level statistics that are applicable to all use-cases.
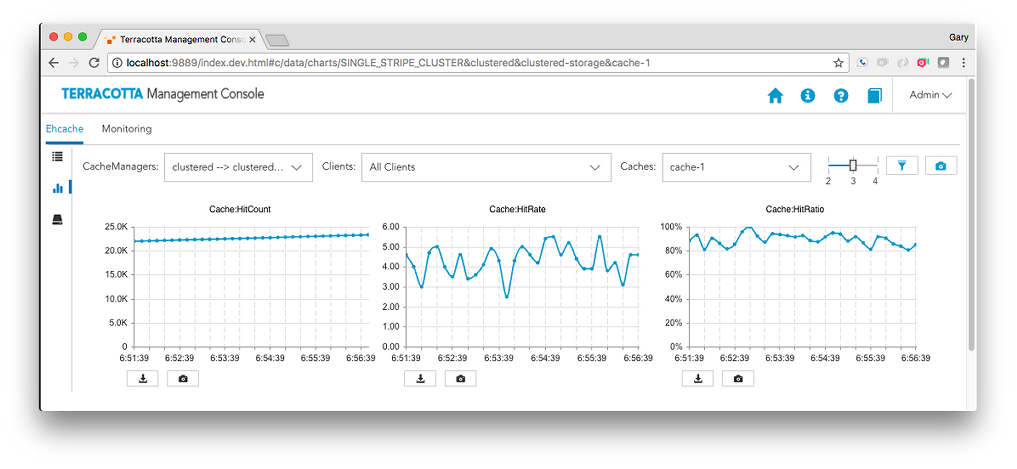
Charts Panel
The Charts Panel lets you view statistics over the past 5 minutes. The TMC requests 30 samples be returned. Unlike the Overview Panel, which shows all the caches contained by the selected CacheManager, the Charts Panel shows statistics for particular caches.
Use the CacheManagers dropdown to select the aliased CacheManager for which to show statistics. The entries in this dropdown are of the form CacheManager Alias > Storage Handle due to the fact that different client-side CacheManagers can be configured to use the same storage on the TSA. Furthermore, CacheManagers that are otherwise identical can be configured with different aliases. We show the mapping here so you have a chance to disambiguate CacheManagers should you choose to configure them in this way.
Use the Clients dropdown to select a particular caching client for viewing. By default, statistics are aggregated across all clients of the selected CacheManager.
Use the Caches dropdown to select a particular cache for viewing. By default, the first cache listed is selected.
Use the slider to set how many columns of charts you would like displayed.
Use the
Filter cache statistics (
) icon to select which statistics to display. The set of statistics to view defaults to
Cache-level statistics that are applicable to all use-cases.
Use the
Take a snapshot of all charts (

) icon to download a single PNG file containing the current values of all displayed charts.
Directly under each individual chart, use the
Export (
) icon or the
Export to PNG image (
) icon to download the chart in either format.
Additional Chart Features
Temporarily re-arrange charts via drag-and-drop
Double-click a chart to get an enlarged snapshot
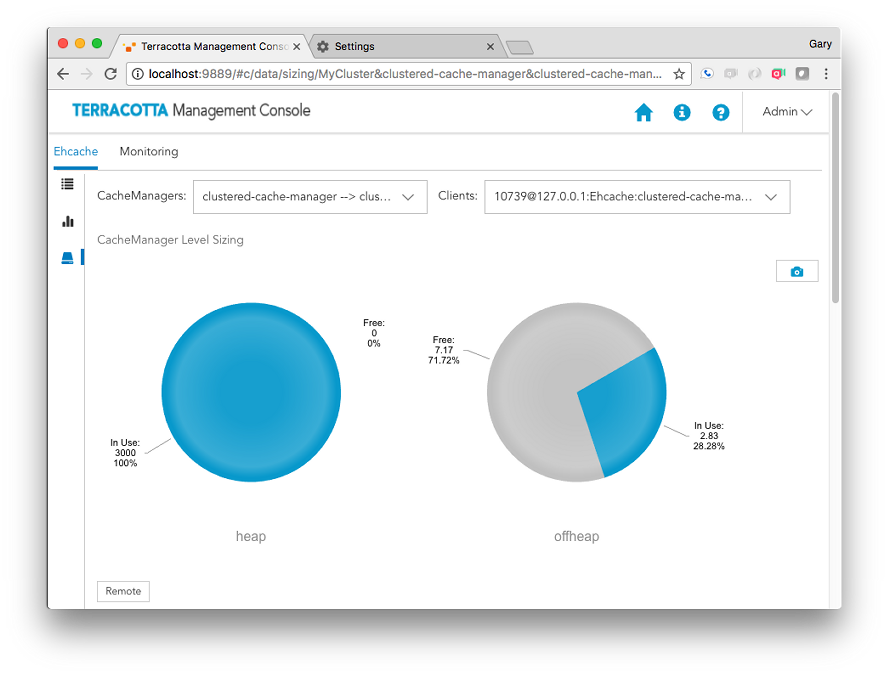
Sizing Panel
The Sizing Panel shows how much space is being used by your CacheManagers and caches across the different local storage tiers you've configured. Sizing information related to the Clustered Storage Tier can be accessed via the Remote buttons.
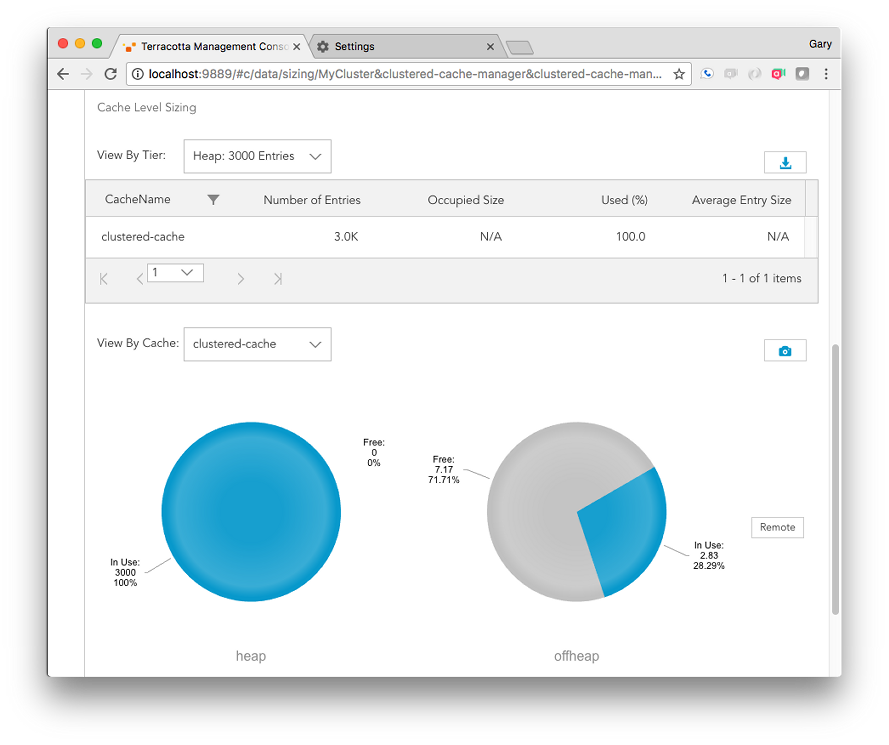
The Sizing Panel is composed of two sections: CacheManager Level Sizing and Cache Level Sizing.
CacheManager Level Sizing Shown is a pie chart for each local storage tier you've configured for use by your caches, displaying the amount of the available storage that is being used.
Use the CacheManagers dropdown to select the aliased CacheManager for which to display sizing information.
Use the Clients dropdown to select a particular caching client for which to display sizing information. By default the first client listed is selected.
Use the Remote button to navigate to the Resource Usage Panel to view how the server-side caching entity is making use of the server’s configured resources, such as OffHeap storage.
Cache Level Sizing Use the View By Tier dropdown to view tier-specific sizing information for all caches contained by the selected CacheManager in grid form.
Byte-sizing Limitations
Cache tiers that are sized by entries cannot provide Occupied Size or Average Entry Size and are displayed as N/A for Not Applicable.
Use the View By Cache dropdown to view the tier usage breakdown for a particular cache, in pie chart form.
About the Monitoring Tab
The Monitoring Tab is where you can find information relating to the cluster-side of your application. There is currently a single panel, Resource Usage, described below.
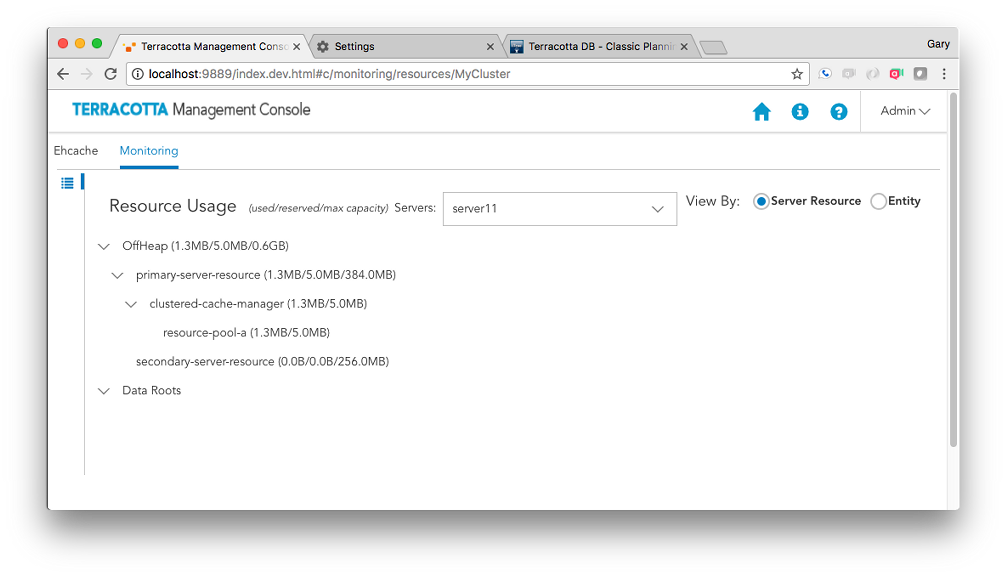
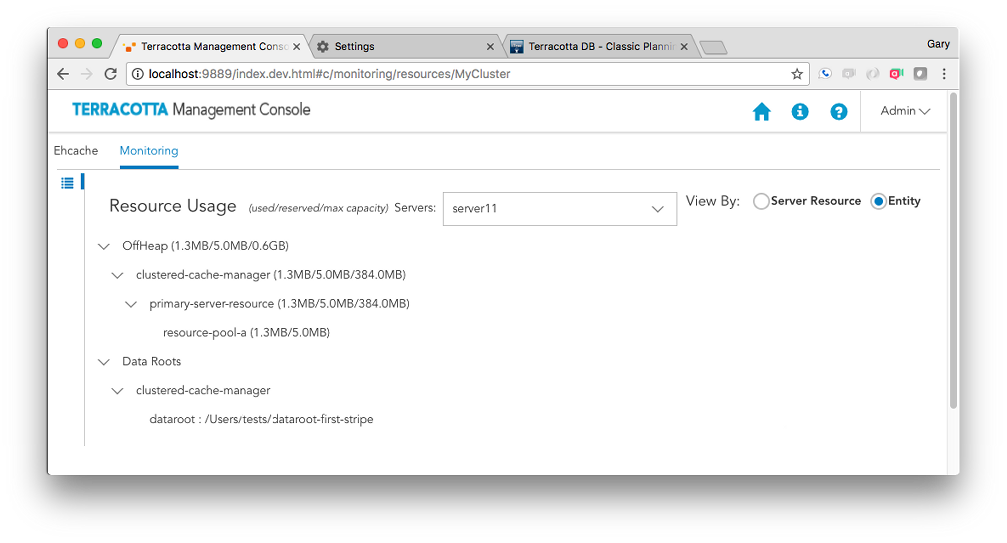
Resource Usage Panel
The Resource Usage Panel displays information relating to your cache's use of the Terracotta Server's configured resources, including OffHeap memory and Fast Restartable Store (FRS) data roots.
Use the Servers dropdown to view the resource usage of a particular Terracotta Server.
Use the View By radio buttons to toggle between a server resource or a caching entity-focused presentation, as shown below.
The Server Resource view shows how caching entities are making use of the allocated OffHeap resources configured for the server. Any number of server entities can use a particular server resource simultaneously.
The Entity view shows how caching entities are using the OffHeap resources configured for the server. A single caching entity can be configured to make use of one or more server resources via the pools (both shared and dedicated) carved out of those server resources.