Configuring Composite Grids
The Composite Grid is in the Composite tab of the object pallet.
The Composite Grid is initialized to display the same sample data as the Table object. The sample data contains seven rows so there are seven instances of the object in the grid. For each row of data the Composite Grid displays an rtv file containing several objects to show the city and unit statistics.
After adding an Object Grid to your dashboard you need to attach its valueTable property to the tabular data to display. See the Object Grid section for details.
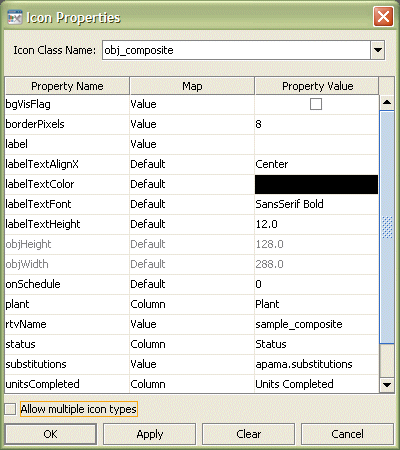
The iconProperties property is used to configure the Composite object displayed in the grid. With the grid object selected, in the Object Properties panel, double-click the iconProperties property to display the Icon Properties dialog.
Notice that Icon Class Name is set to obj_composite.
Within the Icon Properties dialog set the rtvName property to the name of the rtv file to display in the Composite. The list of properties will update to show as properties all the public variables in the selected rtv file.
Note: If the list of properties does not update, close the Icon Properties dialog and redisplay it.
The properties of the Composite object can now be configured in the Icon Properties dialog as needed.
The substitutions property is preset to the value of apama.substitutions.
The effect of this is to set the substitution $instanceId uniquely for each instance of the Composite object displayed in the grid. Each instance will have $instanceId set to a unique instance of the scenario or DataView that the Composite Grid is attached to.


