This document covers the following topics:
The monitoring tool is used to monitor the sessions that are currently running in the local web container environment.
To monitor the sessions of an application that has been deployed to another web container, you use the monitoring tool directly in the deployed application. A link to that monitoring tool is available on the default index page that is packaged along with the application (see also Content of a Natural for Ajax Web Application).
Sessions which are no longer required can be deleted and memory can thus be freed. For more information on sessions, see Details on Session Management in Special Development Topics, which is part of the Application Designer documentation.
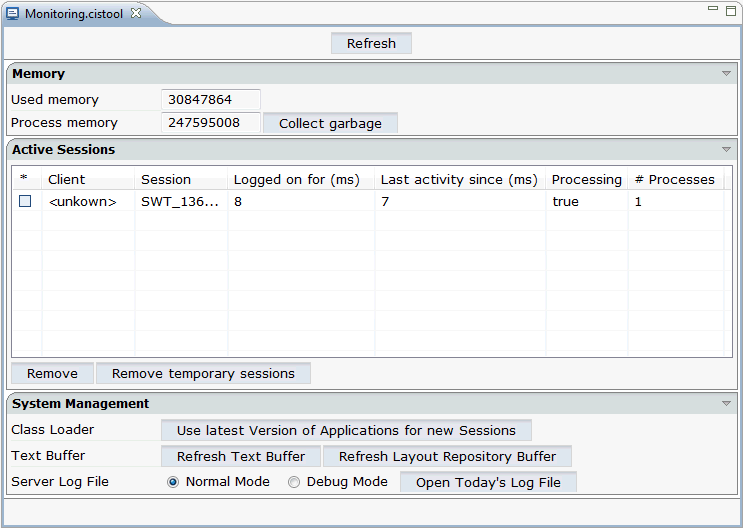
When you invoke the monitoring tool, the following editor appears.

The editor is subdivided into several areas:
Using the button at the very top of the editor, you can reload the information in the editor and thus show the most recent information.
 To invoke the monitoring tool
In the Navigator view, select the project for which you want to invoke the monitoring tool.
Invoke the context menu and from the menu, choose .
The top of the editor provides the following information:
| Option | Description |
|---|---|
| Used memory | This text box indicates the currently used memory. |
| Process memory | This text box indicates the available memory. |
| Collect garbage | When you choose this command button, memory which is no longer used on the server is set free. |
The middle of the editor provides a list with all sessions which are currently active.
The monitoring process itself is also considered as a session. When no other sessions are active, the monitoring process is the only session that is listed in the editor.
The following command buttons are available:
| Command Button | Description |
|---|---|
| When you choose this command button, the selected sessions are removed from the list of active sessions. | |
| When you choose this command button, all sessions (except the monitoring session itself) are removed from the list of active sessions. |
The bottom of the editor provides the following information:
| Option | Description |
|---|---|
| Class Loader | When you choose the command button, a new
class loader instance is generated. The most recent versions of your
applications are then loaded. For example, when an adapter class has been
modified, the modified class is loaded and any changes are immediately in
effect.
See also Class Loader Concepts in Appendices, which is part of the Application Designer documentation. |
| Text Buffer | When you choose the command button, the most recent versions of your language
files are loaded and any changes are immediately in effect.
When you choose the command button, the most recent versions of your layouts are loaded and any changes are immediately in effect. |
| Server Log File | The server log file contains a protocol of all
interactions with the server. You can select the option button for the required
log mode: Normal Mode or Debug Mode.
In debug mode, the log contains more detailed information.
When you choose the command button, a dialog appears showing the content of the log file. |