This document covers the following topics:
See also Natural Buffer Pool which provides general information on the buffer pool and explains how to start the buffer pool.
| Warning: This utility should not be generally accessible to all users of Natural, because its use can cause damage to the work of other users of the buffer pool. |
A Natural folder automatically appears in the folder of the menu after Natural has been installed. It contains the shortcuts for Natural, including the Buffer Pool Monitor.
 To start the Buffer Pool Monitor
From the Windows menu choose .
Note:
The Start menu group name (by
default, this is "Software AG") can be changed
during the installation.
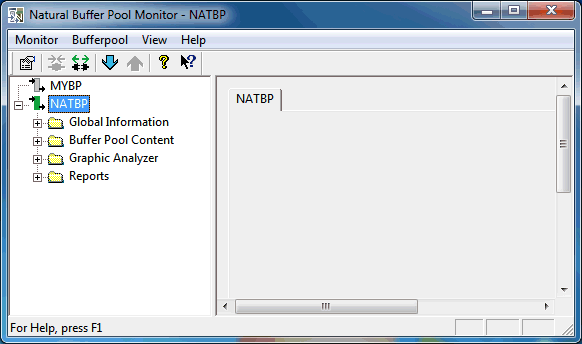
The Natural Buffer Pool Monitor window appears.
Note:
The buffer pool can also be started using the executable
file natbpmong.exe which is stored in the Natural
Bin directory.
To terminate the Buffer Pool Monitor
From the menu, choose .
Or:
Press ALT+F4.
Or:
From the Control menu, choose
.
Or:
Choose the corresponding standard button at the right of
the title bar.
When you start the Buffer Pool Monitor, it automatically tries to
connect to Natural's default buffer pool NATBP. The name of the
buffer pool which is currently used is shown in the title bar. It is also
selected in the tree.
The following topics are covered below:
The following menus are available:
| Menu | Using the commands in this menu, you can ... |
|---|---|
| Change the properties or exit the Buffer Pool Monitor. | |
| Disconnect and connect a buffer pool. Shut down and start the buffer pool server. | |
| Show or hide the various elements of the Natural Buffer Pool Monitor window. | |
| Invoke the online documentation and display information about the Buffer Pool Monitor. |
You can execute the most important functions using a toolbar button. When you move the mouse pointer over a toolbar, a brief description for the button is shown in the status bar.
The following toolbar buttons are available:
|
|
Change properties |
|
|
Connect to another buffer pool |
|
|
Disconnect current buffer pool |
|
|
Shutdown buffer pool server |
|
|
Start buffer pool server |
|
|
Display information about the Buffer Pool Monitor |
|
|
Display online help |
To switch the toolbar display on and off
From the menu, choose .
When the toolbar is displayed in the Natural Buffer Pool Monitor window, a check mark is shown next to this menu command.
The tree on the left side of the Natural Buffer Pool Monitor window shows all buffer pools currently assigned in the local configuration file. See Buffer Pool Assignments in the Configuration Utility documentation.
Only one buffer pool can be monitored at a time. If you want to connect to a different buffer pool, see Connecting and Disconnecting a Buffer Pool.
When all nodes for the buffer pool which is currently used (NATBP in the example below) are expanded, the tree looks as follows.
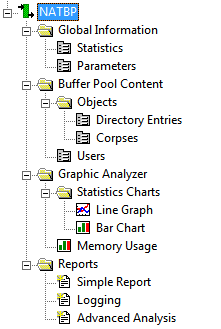
When you select a node in the tree, the corresponding page is shown on the right side of the window. See the following sections for a detailed description of each page:
The status bar is the horizontal information line at the bottom of the Natural Buffer Pool Monitor window. It shows short help texts for the commands in the menu bar and toolbar.
To switch the status bar display on and off
From the menu, choose .
When the status bar is displayed in the Natural Buffer Pool Monitor window, a check mark is shown next to this menu command.
Only one buffer pool can be connected at a time. To switch to another buffer pool in the environment, you disconnect the currently used buffer pool and then connect to the new buffer pool.
Note:
When you connect to another buffer pool, the previously
connected buffer pool is automatically disconnected. Thus, it is not necessary
to use the command first.
The icon next to a buffer pool name indicates one of the following states:
|
|
The Buffer Pool Monitor is connected to the buffer pool (green icon). |
|
|
The Buffer Pool Monitor is not connected to the buffer pool (gray icon). |
To disconnect the currently used buffer pool
Select the name of the currently connected buffer pool in the tree.
From the menu, choose .
Or:
Invoke the context menu and choose
.
Or:
Choose the following toolbar button:
![]()
The tree for this buffer pool is no longer shown.
To connect a buffer pool
Select the name of a buffer pool in the tree.
From the menu, choose .
Or:
Invoke the context menu and choose
.
Or:
Choose the following toolbar button:
![]()
The tree for this buffer pool is shown.
When you are connected to a buffer pool, you can shut it down. For example, if you want to initialize the buffer pool, you shut it down and then restart it.
The buffer pool server will not shut down as long as any Natural process is still connected. It will only shut down after the last process has disconnected from the buffer pool. As long as processes are connected, the buffer pool status is "shutdown pending"; this is indicated in the tree, next to the buffer pool name.
To shut down the buffer pool server
Select the name of the currently connected buffer pool in the tree.
From the menu, choose .
Or:
Invoke the context menu and choose .
Or:
Choose the following toolbar button:
![]()
The tree for this buffer pool is no longer shown.
A buffer pool server can only be started via the Buffer Pool Monitor if a buffer pool server has not yet been started.
To start a buffer pool server
Select the name of a buffer pool in the tree.
From the menu, choose .
Or:
Invoke the context menu and choose .
Or:
Choose the following toolbar button:
![]()
The buffer pool server is started.
This does not automatically connect the buffer pool. You have to connect it manually as described in Disconnecting and Connecting a Buffer Pool.
You can define the files that are to be provided as the defaults on several pages of the Buffer Pool Monitor. You can also define the default text editor that is to be used.
To change the properties
From the menu, choose .
The following dialog box appears. By default, a temporary directory is defined for the current user. Example:
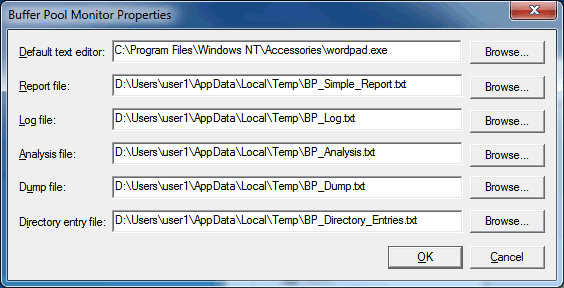
You can change the following information:
The default text editor to be used for opening the text files on the pages listed below.
The report file to be used on the Simple Report page.
The log file to be used on the Logging page.
The analysis file to be used on the Advanced Analysis page.
The dump file to be used on the Advanced Analysis page.
The directory entry file to be used on the Directory Entries page.
If you want to change an entry, specify the path and file name in the corresponding text box.
Or:
Choose the corresponding
button to select the file from a dialog box.
Choose the button.
When you expand the Global Information node in the tree, you can display statistical data of the buffer pool and its parameters.
The following pages are available:
The following page appears when you select Statistics in the tree.
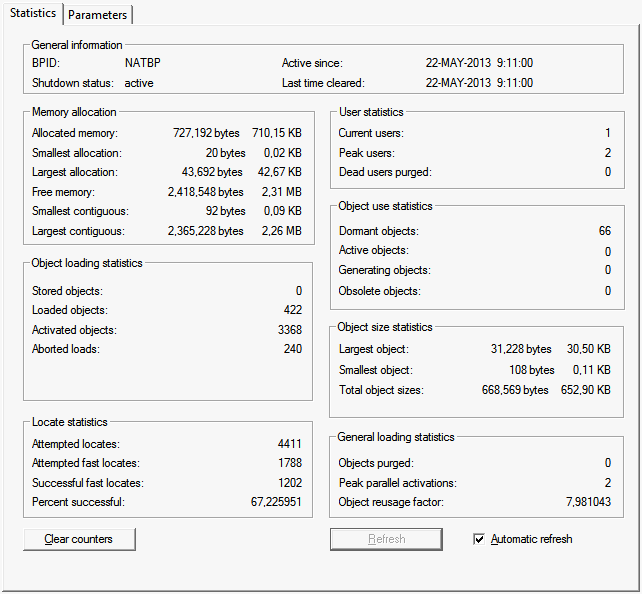
This page shows general information about the buffer pool and
detailed information about memory, users and objects. It shows the same
information as the STATUS command of the
NATBPMON utility; see Statistical Information About the
Buffer Pool for further information.
When the Automatic refresh check box is selected, the page is automatically refreshed every second. When this check box is not selected, you have to refresh the values manually by choosing the button.
When you choose the button, the internal statistics of the buffer pool are reset to zero.
The following page appears when you select Parameters in the tree.
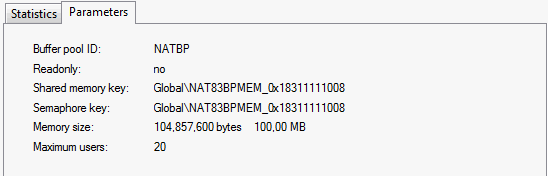
This page shows the same information as the
PARAM command of the NATBPMON utility;
see Displaying the Buffer Pool
Settings.
When you expand the Buffer Pool Content node in the tree, you can display details about the Natural objects which have been loaded into the buffer pool, as well as the users who are accessing them.
The following pages are available:
The following page appears when you expand the Objects node in the tree and select Directory Entries.
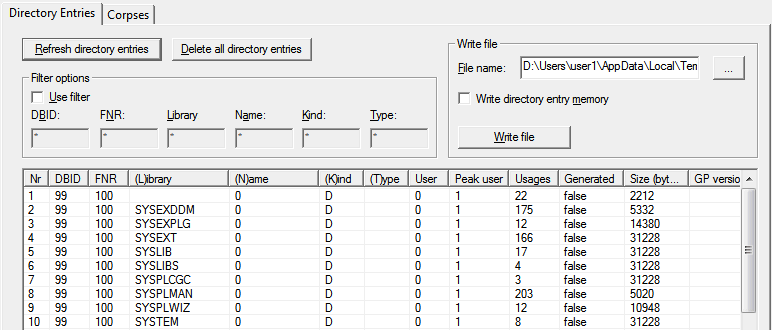
This page provides a table containing information on all
currently loaded directory entries. It shows the same information as the
DIR command of the NATBPMON utility;
see also Displaying the Objects
in the Buffer Pool.
The following command buttons are provided:
| Command Button | Description |
|---|---|
| Updates the table. | |
| Deletes all Natural objects which are currently loaded in the buffer pool. |
When the mouse is positioned over the table, you can invoke a context menu containing the following commands:
| Command in Context Menu | Description |
|---|---|
| Selects all entries in the table. | |
| Deletes the selected entries in the table. |
Using a filter, you can reduce the number of directory entries that are shown in the table.
To define a filter
Activate the Use filter check box.
Specify the filter criteria in the text boxes DBID, FNR, Library, Name, Kind and/or Type.
For example, to display all programs in the libraries starting with "MY", specify "MY*" in the Library text box, and "P" in the Type text box.
Choose the button to update the table.
You can write all directory entries which are currently shown in the table to a file. If required, the memory of the directory entries can also be written to this file.
To write the directory entries to a file
Optional. In the File name text box, specify the path to the file to which the directory entries are to be written.
Or:
Use the button to the right of this text box to select the
file from a dialog box.
Note:
By default, the File name text box
contains the path to the file which has been defined in the
properties.
Optional. If the memory of the directory entries is to be written to this file, activate the Write directory entry memory check box.
Choose the button.
The information is written to the specified file. The content of this file is automatically shown in the text editor which has been defined in the properties.
The following page appears when you expand the Objects node in the tree and select Corpses.
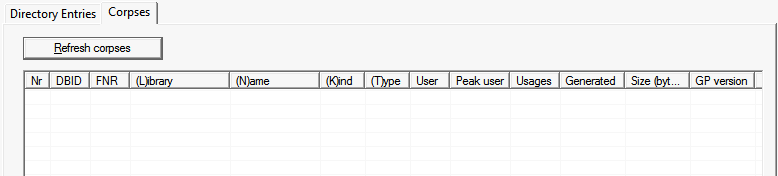
A corpse is an object which is to be deleted from the buffer pool, but is still in use. When corpses are available, they are shown in the table.
You can use the button to update the table.
The following page appears when you select Users in the tree.
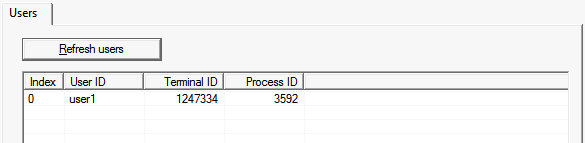
This page shows a table containing information on the users who are currently using the buffer pool.
You can use the button to update the table.
When you expand the Graphic Analyzer node in the tree, you can display graphical representations of the statistical numbers and a direct view on what is taking place inside the buffer pool memory.
The following pages are available:
The following page appears when you expand the Statistics Charts node in the tree and select Line Graph. When you have added data sources and have started the analyzer, this page may look as follows:
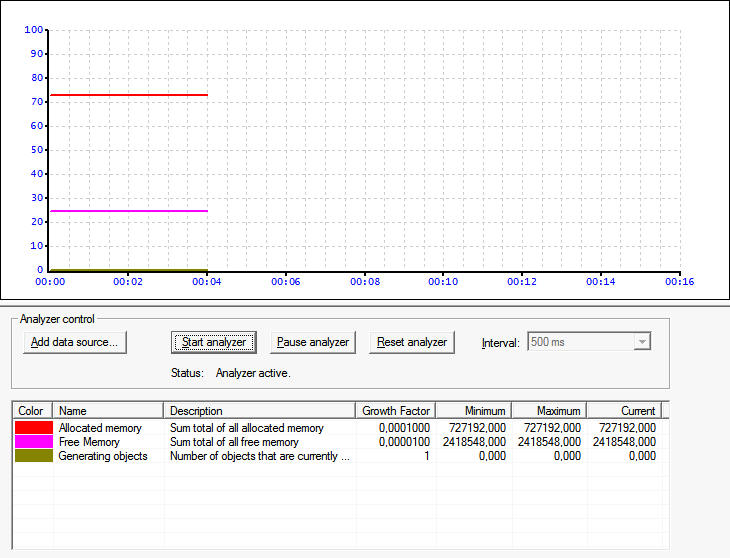
The line graph and the bar chart are both working with the same statistical data sources. When you apply one of the following actions to the line graph, this action is also applied to the bar chart, and vice versa:
add, modify or delete a data source,
start, pause or reset the analyzer,
adjust the update interval.
Note:
The analyzer is also used on the
Memory
Usage page.
To add data sources
Choose the button.
The Data Source dialog box appears.
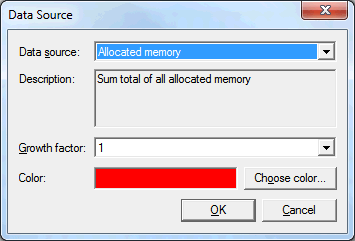
From the Data source drop-down list box, select the data source that is to be shown in the chart.
A description is shown for the selected data source.
Optional. From the Growth factor drop-down list box, select the required value for the selected data source.
This adjusts the range on the y-axis. The current value of the data source is multiplied by that factor to accomplish an appropriate representation on the chart.
Optional. If you want to define a different color for the selected data source, choose the button.
The standard Windows Color dialog box appears in which you can select or define another color to be used for the data source.
Choose the button to add the data source to the table which is shown at the bottom of the page. The data source is then available for both the line graph and the bar chart.
The table shows the color, name, description and growth factor of each data source that you have added. It also shows the minimum, maximum and current values of the data source.
Optional. Repeat the above steps, if you want to add further data sources to the table.
Managing the defined data sources
Select a data source in the table and invoke the context menu.
The context menu contains the following commands:
| Command in Context Menu | Description |
|---|---|
| Invokes the Data Source dialog box for the selected data source. In this case, the dialog box can only be used to define another color. | |
| Selects all data sources in the table. | |
| Deletes the selected data source(s) in the table. |
Choose one of the above commands.
To adjust the update interval
From the Interval drop-down list box, select the update time (different values are provided for updating in milliseconds, seconds or minutes).
The update interval is adjusted for the charts.
Note:
The Interval drop-down list box is
only available when the analyzer is inactive.
To start the analyzer
When all required data sources have been added to the table, choose the button.
This starts the analyzer in all charts. The graphical representation of the selected data sources is painted in the line graph and in the bar chart.
To pause the analyzer
Choose the button.
This freezes the current state of the graphical representation in all charts.
To reset the analyzer
Choose the button.
This resets the graphical representation in all charts. For the line graph and bar chart, the minimum, maximum and current values are reset in the table. The time base which is shown in the line graph is also reset.
The following page appears when you expand the Statistics Charts node in the tree and select Bar Chart. When you have added data sources and have started the analyzer, this page may look as follows:
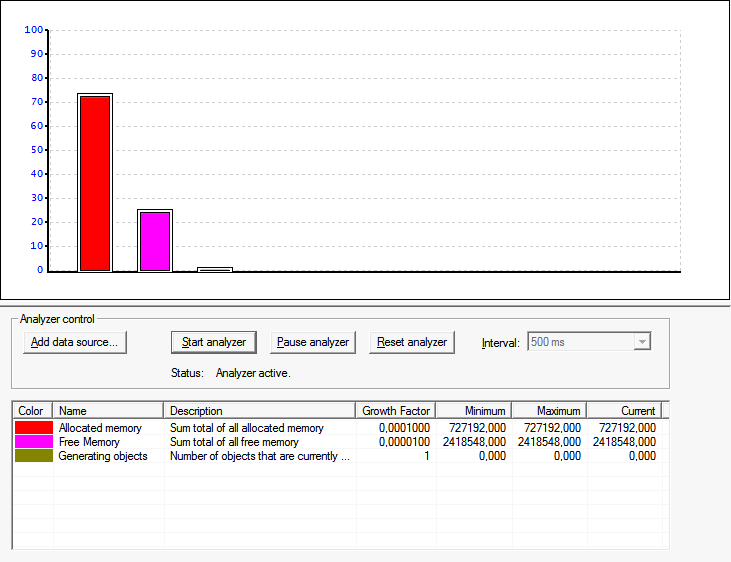
When you apply an action to the line graph, this action is also applied to the bar chart, and vice versa. See Line Graph for detailed information on how to add, modify and delete data sources, how to start, pause and reset the analyzer, and how to adjust the update interval.
The following page appears when you select Memory Usage in the tree.
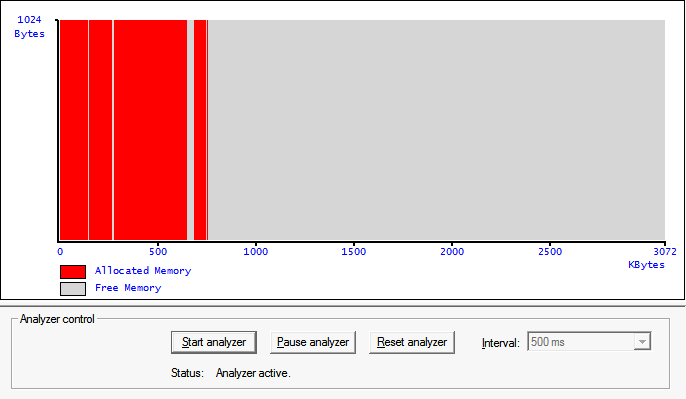
This chart simply shows the structure of the buffer pool memory. It shows allocated and free memory.
When the analyzer is active for a line graph or bar chart, it is also active on this page, and vice versa. See Line Graph for detailed information on how to start, pause and reset the analyzer, and how to adjust the update interval.
When you expand the Reports node in the tree, several pages are available. They can be used to write certain types of information about the buffer pool into a file.
The following pages are available:
The following page appears when you select Simple Report in the tree.
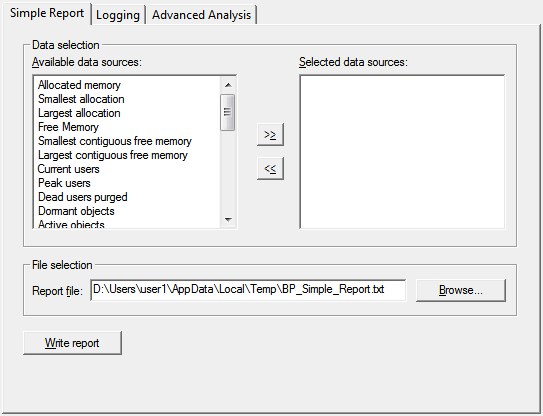
You can write a report which contains information on the data sources that you select on this page.
To select the data sources and write the report
Select one or more data sources in the Available data sources list box.
Choose the button.
The selected data sources are moved to the Selected data sources list box.
Note:
If you have accidentally moved the wrong data source to
the Selected data sources list box, you can move it back
to the Available data sources list box by choosing the
button.
Optional. In the Report file text box, specify the path to the file to which the report is to be written.
Or:
Choose the button to select
the file from a dialog box.
Note:
By default, the Report file text
box contains the path to the file which has been defined in the
properties.
Choose the button.
The report is written to the specified file. The content of this file is automatically shown in the text editor which has been defined in the properties.
The following page appears when you select Logging in the tree.
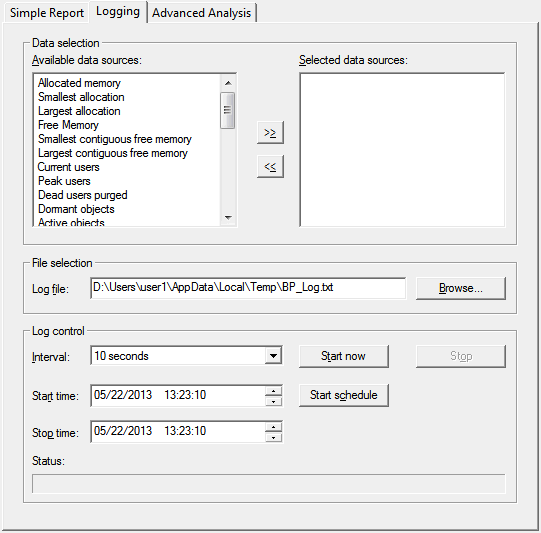
The upper part of this page contains the same information as the Simple Report page. The only difference is that a different log file is used by default.
In addition to selecting the data sources in upper part of this page, you can decide whether the log file is to be written immediately (manually) or whether it is to be scheduled for a specific time range.
To start the logging process manually
Select all data sources and (optionally) the log file as described for the Simple Report page.
From the Interval drop-down list box, select the interval which determines how often the log information is to be written to the file.
Choose the button to start writing information to the log file.
A status message indicating the number of done circles and the elasped time is shown at the bottom of the Log control group box.
Choose the button to stop writing information to the log file.
When the logging process has been stopped, the content of the log file is automatically shown in the text editor which has been defined in the properties.
To schedule the log process for a specific time range
Select all data sources and (optionally) the log file as described for the Simple Report page.
From the Interval drop-down list box, select the interval which determines how often the log information is to be written to the file.
Specify a start date and time.
Specify a stop date and time.
Choose the button.
A status message is shown at the bottom of the Log control group box. It indicates the time that is to elapse until the log process is started. When the start time is reached, a different status message is shown which indicates the number of done circles and the elasped time.
Note:
You can choose the button
to cancel the schedule before the specified start time.
When the stop time is reached (or when you choose the button after the start time has been reached), the content of the log file is automatically shown in the text editor which has been defined in the properties.
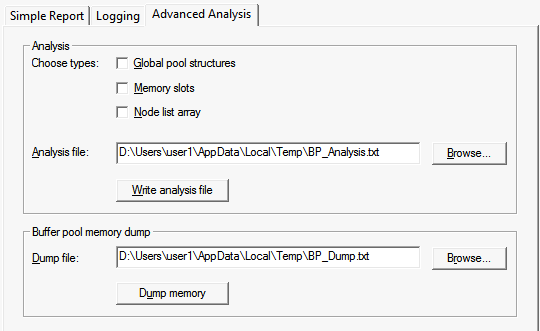
The following page appears when you select Advanced Analysis in the tree. It provides information for the Software AG support team.
Important:
Do not use this page unless you are requested to do so
by Software AG Support.